Electronic Arts 2012 Annual Report Download - page 41
Download and view the complete annual report
Please find page 41 of the 2012 Electronic Arts annual report below. You can navigate through the pages in the report by either clicking on the pages listed below, or by using the keyword search tool below to find specific information within the annual report.-
 1
1 -
2
-
3
-
4
-
5
-
6
-
7
-
8
-
9
-
10
-
11
-
12
-
13
-
14
-
15
-
16
-
17
-
18
-
19
-
20
-
21
-
22
-
23
-
24
-
25
-
26
-
27
-
28
-
29
-
30
-
 31
31 -
 32
32 -
 33
33 -
 34
34 -
 35
35 -
 36
36 -
 37
37 -
 38
38 -
 39
39 -
 40
40 -
 41
41 -
 42
42 -
 43
43 -
 44
44 -
 45
45 -
 46
46 -
 47
47 -
 48
48 -
 49
49 -
 50
50 -
 51
51 -
52
-
53
-
54
-
55
-
56
-
57
-
58
-
59
-
60
-
61
-
62
-
63
-
64
-
65
-
66
-
67
-
68
-
69
-
70
-
71
-
72
-
73
-
74
-
75
-
76
-
77
-
78
-
79
-
80
-
81
-
82
-
83
-
84
-
85
-
86
-
87
-
88
-
89
-
90
-
91
-
92
-
93
-
94
-
95
-
96
-
97
-
98
-
99
-
100
-
101
-
102
-
103
-
104
-
105
-
106
-
107
-
108
-
109
-
110
-
111
-
112
-
113
-
114
-
115
-
116
-
117
-
118
-
119
-
120
-
121
-
122
-
123
-
124
-
125
-
126
-
127
-
128
-
129
-
130
-
131
-
132
-
133
-
134
-
135
-
136
-
137
-
138
-
139
-
140
-
141
-
142
-
143
-
144
-
145
-
146
-
147
-
148
-
149
-
150
-
151
-
152
-
153
-
154
-
155
-
156
-
157
-
158
-
159
-
160
-
161
-
162
-
163
-
164
-
165
-
166
-
167
-
168
-
169
-
170
-
171
-
172
-
173
-
174
-
175
-
176
-
177
-
178
-
179
-
180
-
181
-
182
-
183
-
184
-
185
-
186
-
187
-
188
-
189
-
190
-
191
-
192
-
193
-
194
-
195
-
196
-
197
-
198
-
199
-
200
-
201
-
202
-
203
-
204
-
205
-
206
-
207
-
208
 |
 |
Proxy Statement
EXECUTIVE COMPENSATION
COMPENSATION DISCUSSION AND ANALYSIS
This Compensation Discussion and Analysis describes the fiscal 2012 compensation paid to our named executive
officers (the “NEOs”), the compensation decisions made by our Executive Compensation and Leadership
Committee (the “Committee”), and the financial, strategic, and operational performance factors that guided those
decisions. Our NEOs for fiscal 2012 were:
• John S. Riccitiello, Chief Executive Officer (“CEO”);
• Kenneth A. Barker, Interim Chief Financial Officer, and Senior Vice President, Chief Accounting
Officer;
• Frank D. Gibeau, President, EA Labels;
• Peter R. Moore, Chief Operating Officer;
• Rajat Taneja, Executive Vice President, Chief Technology Officer; and
• Eric F. Brown, former Executive Vice President, Chief Financial Officer.
FISCAL YEAR OVERVIEW
In fiscal 2012, the Company continued to execute successfully on our multi-year strategy to transform from a
business predominately based on packaged goods sales to a business that is centered on the digital distribution of
interactive entertainment directly to consumers. For the third fiscal year in a row, we achieved significant
non-GAAP diluted earnings per share and digital revenue growth as our digital transformation touched every
aspect of our financial performance, operations, and corporate structure.
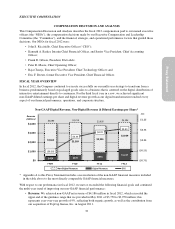
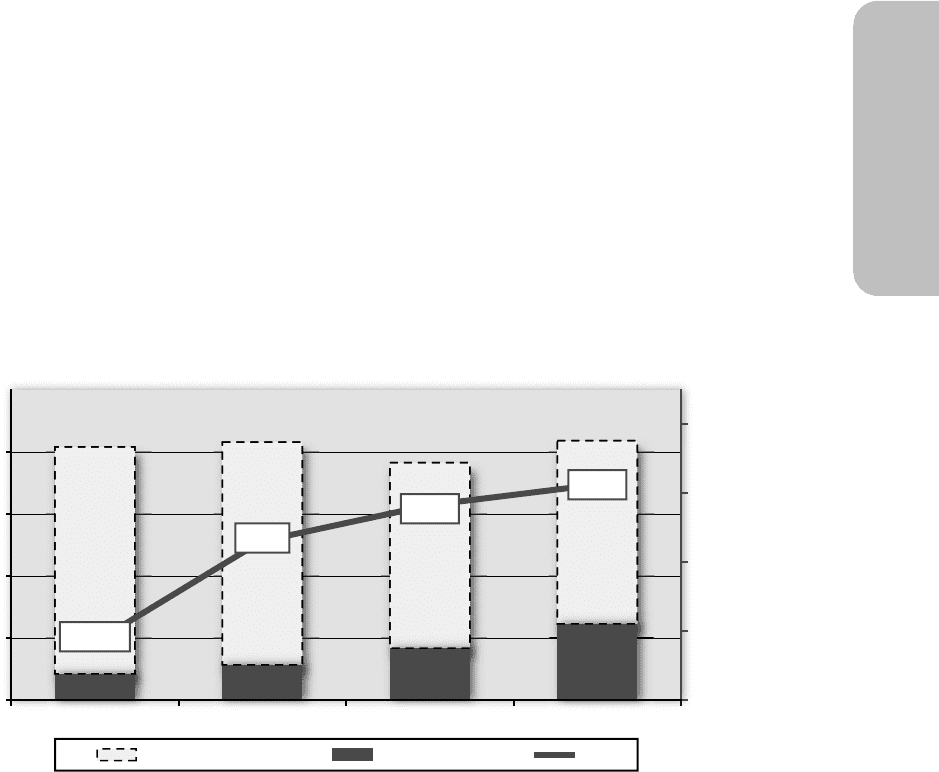
Non-GAAP Digital Revenue, Non-Digital Revenue & Diluted Earnings per Share*
FY09 FY10 FY11 FY12
$0
$1,000
$2,000
$3,000
$4,000
$3,662 $3,589 $2,995
$2,959
$4,086 $4,159 $3,828 $4,186
$424 $570 $833 $1,227
($0.75)
($0.25)
$0.25
$0.75
$1.25
EPS
Non-Digital Revenue Digital Revenue EPS
Revenue
(millions)
$0.85
$0.70
$0.44
($0.30)
* Appendix A to this Proxy Statement includes a reconciliation of the non-GAAP financial measures included
in the table above to the most directly comparable GAAP financial measures.
With respect to our performance in fiscal 2012, we met or exceeded the following financial goals and continued
the multi-year trend of improving our non-GAAP financial performance:
•Revenue: We achieved non-GAAP net revenue of $4,186 million in fiscal 2012, which exceeded the
upper end of the guidance range that we provided in May 2011 of $3,750 to $3,950 million; this
represents year-over-year growth of 9%, reflecting both organic growth, as well as the contribution from
our acquisition of PopCap Games, Inc. in August 2011.
33