Electronic Arts 2012 Annual Report Download - page 149
Download and view the complete annual report
Please find page 149 of the 2012 Electronic Arts annual report below. You can navigate through the pages in the report by either clicking on the pages listed below, or by using the keyword search tool below to find specific information within the annual report.-
 1
1 -
2
-
3
-
4
-
5
-
6
-
7
-
8
-
9
-
10
-
11
-
12
-
13
-
14
-
15
-
16
-
17
-
18
-
19
-
20
-
21
-
22
-
23
-
24
-
25
-
26
-
27
-
28
-
29
-
30
-
31
-
32
-
33
-
34
-
35
-
36
-
37
-
38
-
39
-
40
-
41
-
42
-
43
-
44
-
45
-
46
-
47
-
48
-
49
-
50
-
51
-
52
-
53
-
54
-
55
-
56
-
57
-
58
-
59
-
60
-
61
-
62
-
63
-
64
-
65
-
66
-
67
-
68
-
69
-
70
-
71
-
72
-
73
-
74
-
75
-
76
-
77
-
78
-
79
-
80
-
81
-
82
-
83
-
84
-
85
-
86
-
87
-
88
-
89
-
90
-
91
-
92
-
93
-
94
-
95
-
96
-
97
-
98
-
99
-
100
-
101
-
102
-
103
-
104
-
105
-
106
-
107
-
108
-
109
-
110
-
111
-
112
-
113
-
114
-
115
-
116
-
117
-
118
-
119
-
120
-
121
-
122
-
123
-
124
-
125
-
126
-
127
-
128
-
129
-
130
-
131
-
132
-
133
-
134
-
135
-
136
-
137
-
138
-
 139
139 -
 140
140 -
 141
141 -
 142
142 -
 143
143 -
 144
144 -
 145
145 -
 146
146 -
 147
147 -
 148
148 -
 149
149 -
 150
150 -
 151
151 -
 152
152 -
 153
153 -
 154
154 -
 155
155 -
 156
156 -
 157
157 -
 158
158 -
 159
159 -
160
-
161
-
162
-
163
-
164
-
165
-
166
-
167
-
168
-
169
-
170
-
171
-
172
-
173
-
174
-
175
-
176
-
177
-
178
-
179
-
180
-
181
-
182
-
183
-
184
-
185
-
186
-
187
-
188
-
189
-
190
-
191
-
192
-
193
-
194
-
195
-
196
-
197
-
198
-
199
-
200
-
201
-
202
-
203
-
204
-
205
-
206
-
207
-
208
 |
 |

Annual Report
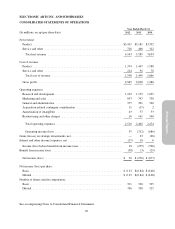
ELECTRONIC ARTS INC. AND SUBSIDIARIES
CONSOLIDATED STATEMENTS OF OPERATIONS
Year Ended March 31,
(In millions, except per share data) 2012 2011 2010
Net revenue:
Product ............................................................ $3,415 $3,181 $3,332
Service and other .................................................... 728 408 322
Total net revenue .................................................. 4,143 3,589 3,654
Cost of revenue:
Product ............................................................ 1,374 1,407 1,788
Service and other .................................................... 224 92 78
Total cost of revenue ............................................... 1,598 1,499 1,866
Gross profit ......................................................... 2,545 2,090 1,788
Operating expenses:
Research and development ............................................. 1,212 1,153 1,229
Marketing and sales .................................................. 853 747 730
General and administrative ............................................ 375 301 320
Acquisition-related contingent consideration .............................. 11 (17) 2
Amortization of intangibles ............................................ 43 57 53
Restructuring and other charges ......................................... 16 161 140
Total operating expenses ............................................ 2,510 2,402 2,474
Operating income (loss) ............................................. 35 (312) (686)
Gains (losses) on strategic investments, net .................................. — 23 (26)
Interest and other income (expense), net .................................... (17) 10 6
Income (loss) before benefit from income taxes ............................ 18 (279) (706)
Benefit from income taxes ............................................... (58) (3) (29)
Net income (loss) .................................................... $ 76 $ (276) $ (677)
Net income (loss) per share:
Basic .............................................................. $ 0.23 $ (0.84) $ (2.08)
Diluted ............................................................ $ 0.23 $ (0.84) $ (2.08)
Number of shares used in computation:
Basic .............................................................. 331 330 325
Diluted ............................................................ 336 330 325
See accompanying Notes to Consolidated Financial Statements.
65