Electronic Arts 2012 Annual Report Download - page 75
Download and view the complete annual report
Please find page 75 of the 2012 Electronic Arts annual report below. You can navigate through the pages in the report by either clicking on the pages listed below, or by using the keyword search tool below to find specific information within the annual report.-
 1
1 -
2
-
3
-
4
-
5
-
6
-
7
-
8
-
9
-
10
-
11
-
12
-
13
-
14
-
15
-
16
-
17
-
18
-
19
-
20
-
21
-
22
-
23
-
24
-
25
-
26
-
27
-
28
-
29
-
30
-
31
-
32
-
33
-
34
-
35
-
36
-
37
-
38
-
39
-
40
-
41
-
42
-
43
-
44
-
45
-
46
-
47
-
48
-
49
-
50
-
51
-
52
-
53
-
54
-
55
-
56
-
57
-
58
-
59
-
60
-
61
-
62
-
63
-
64
-
 65
65 -
 66
66 -
 67
67 -
 68
68 -
 69
69 -
 70
70 -
 71
71 -
 72
72 -
 73
73 -
 74
74 -
 75
75 -
 76
76 -
 77
77 -
 78
78 -
 79
79 -
 80
80 -
 81
81 -
 82
82 -
 83
83 -
 84
84 -
 85
85 -
86
-
87
-
88
-
89
-
90
-
91
-
92
-
93
-
94
-
95
-
96
-
97
-
98
-
99
-
100
-
101
-
102
-
103
-
104
-
105
-
106
-
107
-
108
-
109
-
110
-
111
-
112
-
113
-
114
-
115
-
116
-
117
-
118
-
119
-
120
-
121
-
122
-
123
-
124
-
125
-
126
-
127
-
128
-
129
-
130
-
131
-
132
-
133
-
134
-
135
-
136
-
137
-
138
-
139
-
140
-
141
-
142
-
143
-
144
-
145
-
146
-
147
-
148
-
149
-
150
-
151
-
152
-
153
-
154
-
155
-
156
-
157
-
158
-
159
-
160
-
161
-
162
-
163
-
164
-
165
-
166
-
167
-
168
-
169
-
170
-
171
-
172
-
173
-
174
-
175
-
176
-
177
-
178
-
179
-
180
-
181
-
182
-
183
-
184
-
185
-
186
-
187
-
188
-
189
-
190
-
191
-
192
-
193
-
194
-
195
-
196
-
197
-
198
-
199
-
200
-
201
-
202
-
203
-
204
-
205
-
206
-
207
-
208
 |
 |

Proxy Statement
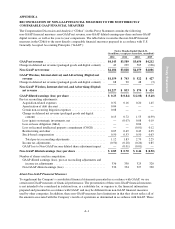
APPENDIX A
RECONCILIATION OF NON-GAAP FINANCIAL MEASURES TO THE MOST DIRECTLY
COMPARABLE GAAP FINANCIAL MEASURES
The Compensation Discussion and Analysis (“CD&A”) in this Proxy Statement contains the following
non-GAAP financial measures: non-GAAP net revenue, non-GAAP diluted earnings-per-share and non-GAAP
digital revenue, as well as the year-to-year comparisons. The table below reconciles the non-GAAP financial
measures in the CD&A to the most directly comparable financial measures prepared in accordance with U.S.
Generally Accepted Accounting Principles (“GAAP”):
Twelve Months Ended March 31,
(In millions, except per share data, unaudited)
2012 2011 2010 2009
GAAP net revenue .......................................... $4,143 $3,589 $3,654 $4,212
Change in deferred net revenue (packaged goods and digital content) . . 43 239 505 (126)
Non-GAAP net revenue ..................................... $4,186 $3,828 $4,159 $4,086
GAAP Wireless, Internet-derived, and Advertising (Digital) net
revenue ................................................. $1,159 $ 743 $ 522 $ 427
Change in deferred net revenue (packaged goods and digital content) . . 68 90 48 (3)
Non-GAAP Wireless, Internet-derived, and Advertising (Digital)
net revenue .............................................. $1,227 $ 833 $ 570 $ 424
GAAP diluted earnings (loss) per share ........................ $ 0.23 $ (0.84) $ (2.08) $ (3.40)
Pre-tax reconciling adjustments:
Acquisition-related expenses ................................ 0.32 0.16 0.20 1.45
Amortization of debt discount ................................ 0.04———
Certain non-recurring litigation expenses ....................... 0.08———
Change in deferred net revenue (packaged goods and digital
content) ............................................... 0.13 0.72 1.55 (0.39)
Loss (gain) on strategic investments, net ....................... — (0.07) 0.08 0.19
Loss on lease obligation (G&A) .............................. — — 0.04 —
Loss on licensed intellectual property commitment (COGS) ........ — — (0.01) 0.12
Restructuring and other ..................................... 0.05 0.49 0.43 0.25
Stock-based compensation .................................. 0.50 0.53 0.50 0.63
Total pre-tax reconciling adjustments ........................ 1.12 1.83 2.79 2.25
Income tax adjustments ..................................... (0.50) (0.28) (0.26) 0.85
GAAP loss to Non-GAAP income diluted share adjustment impact . . — (0.01) (0.01) —
Non-GAAP diluted earnings (loss) per share .................... $ 0.85 $ 0.70 $ 0.44 $ (0.30)
Number of shares used in computation:
GAAP diluted earnings (loss), pre-tax reconciling adjustments and
income tax adjustments ................................... 336 330 325 320
Non-GAAP diluted earnings (loss) ............................ 336 334 327 320
About Non-GAAP Financial Measures
To supplement the Company’s consolidated financial statements presented in accordance with GAAP, we use
certain non-GAAP measures of financial performance. The presentation of these non-GAAP financial measures
is not intended to be considered in isolation from, as a substitute for, or superior to, the financial information
prepared and presented in accordance with GAAP, and may be different from non-GAAP financial measures
used by other companies. In addition, these non-GAAP measures have limitations in that they do not reflect all of
the amounts associated with the Company’s results of operations as determined in accordance with GAAP. These
A-1