Electronic Arts 2012 Annual Report Download - page 146
Download and view the complete annual report
Please find page 146 of the 2012 Electronic Arts annual report below. You can navigate through the pages in the report by either clicking on the pages listed below, or by using the keyword search tool below to find specific information within the annual report.-
 1
1 -
2
-
3
-
4
-
5
-
6
-
7
-
8
-
9
-
10
-
11
-
12
-
13
-
14
-
15
-
16
-
17
-
18
-
19
-
20
-
21
-
22
-
23
-
24
-
25
-
26
-
27
-
28
-
29
-
30
-
31
-
32
-
33
-
34
-
35
-
36
-
37
-
38
-
39
-
40
-
41
-
42
-
43
-
44
-
45
-
46
-
47
-
48
-
49
-
50
-
51
-
52
-
53
-
54
-
55
-
56
-
57
-
58
-
59
-
60
-
61
-
62
-
63
-
64
-
65
-
66
-
67
-
68
-
69
-
70
-
71
-
72
-
73
-
74
-
75
-
76
-
77
-
78
-
79
-
80
-
81
-
82
-
83
-
84
-
85
-
86
-
87
-
88
-
89
-
90
-
91
-
92
-
93
-
94
-
95
-
96
-
97
-
98
-
99
-
100
-
101
-
102
-
103
-
104
-
105
-
106
-
107
-
108
-
109
-
110
-
111
-
112
-
113
-
114
-
115
-
116
-
117
-
118
-
119
-
120
-
121
-
122
-
123
-
124
-
125
-
126
-
127
-
128
-
129
-
130
-
131
-
132
-
133
-
134
-
135
-
 136
136 -
 137
137 -
 138
138 -
 139
139 -
 140
140 -
 141
141 -
 142
142 -
 143
143 -
 144
144 -
 145
145 -
 146
146 -
 147
147 -
 148
148 -
 149
149 -
 150
150 -
 151
151 -
 152
152 -
 153
153 -
 154
154 -
 155
155 -
 156
156 -
157
-
158
-
159
-
160
-
161
-
162
-
163
-
164
-
165
-
166
-
167
-
168
-
169
-
170
-
171
-
172
-
173
-
174
-
175
-
176
-
177
-
178
-
179
-
180
-
181
-
182
-
183
-
184
-
185
-
186
-
187
-
188
-
189
-
190
-
191
-
192
-
193
-
194
-
195
-
196
-
197
-
198
-
199
-
200
-
201
-
202
-
203
-
204
-
205
-
206
-
207
-
208
 |
 |

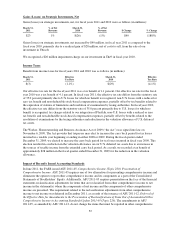
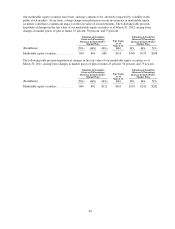
Our marketable equity securities have been, and may continue to be, adversely impacted by volatility in the
public stock markets. At any time, a sharp change in market prices in our investments in marketable equity
securities could have a significant impact on the fair value of our investments. The following table presents
hypothetical changes in the fair value of our marketable equity securities as of March 31, 2012, arising from
changes in market prices of plus or minus 25 percent, 50 percent, and 75 percent.
Valuation of Securities
Given an X Percentage
Decrease in Each Stock’s
Market Price
Fair Value
as of
March 31,
2012
Valuation of Securities
Given an X Percentage
Increase in Each Stock’s
Market Price
(In millions) (75%) (50%) (25%) 25% 50% 75%
Marketable equity securities ........... $30 $60 $89 $119 $149 $179 $208
The following table presents hypothetical changes in the fair value of our marketable equity securities as of
March 31, 2011, arising from changes in market prices of plus or minus 25 percent, 50 percent, and 75 percent.
Valuation of Securities
Given an X Percentage
Decrease in Each Stock’s
Market Price
Fair Value
as of
March 31,
2011
Valuation of Securities
Given an X Percentage
Increase in Each Stock’s
Market Price
(In millions) (75%) (50%) (25%) 25% 50% 75%
Marketable equity securities ........... $40 $81 $121 $161 $201 $242 $282
62