Electronic Arts 2012 Annual Report Download - page 131
Download and view the complete annual report
Please find page 131 of the 2012 Electronic Arts annual report below. You can navigate through the pages in the report by either clicking on the pages listed below, or by using the keyword search tool below to find specific information within the annual report.-
 1
1 -
2
-
3
-
4
-
5
-
6
-
7
-
8
-
9
-
10
-
11
-
12
-
13
-
14
-
15
-
16
-
17
-
18
-
19
-
20
-
21
-
22
-
23
-
24
-
25
-
26
-
27
-
28
-
29
-
30
-
31
-
32
-
33
-
34
-
35
-
36
-
37
-
38
-
39
-
40
-
41
-
42
-
43
-
44
-
45
-
46
-
47
-
48
-
49
-
50
-
51
-
52
-
53
-
54
-
55
-
56
-
57
-
58
-
59
-
60
-
61
-
62
-
63
-
64
-
65
-
66
-
67
-
68
-
69
-
70
-
71
-
72
-
73
-
74
-
75
-
76
-
77
-
78
-
79
-
80
-
81
-
82
-
83
-
84
-
85
-
86
-
87
-
88
-
89
-
90
-
91
-
92
-
93
-
94
-
95
-
96
-
97
-
98
-
99
-
100
-
101
-
102
-
103
-
104
-
105
-
106
-
107
-
108
-
109
-
110
-
111
-
112
-
113
-
114
-
115
-
116
-
117
-
118
-
119
-
120
-
 121
121 -
 122
122 -
 123
123 -
 124
124 -
 125
125 -
 126
126 -
 127
127 -
 128
128 -
 129
129 -
 130
130 -
 131
131 -
 132
132 -
 133
133 -
 134
134 -
 135
135 -
 136
136 -
 137
137 -
 138
138 -
 139
139 -
 140
140 -
 141
141 -
142
-
143
-
144
-
145
-
146
-
147
-
148
-
149
-
150
-
151
-
152
-
153
-
154
-
155
-
156
-
157
-
158
-
159
-
160
-
161
-
162
-
163
-
164
-
165
-
166
-
167
-
168
-
169
-
170
-
171
-
172
-
173
-
174
-
175
-
176
-
177
-
178
-
179
-
180
-
181
-
182
-
183
-
184
-
185
-
186
-
187
-
188
-
189
-
190
-
191
-
192
-
193
-
194
-
195
-
196
-
197
-
198
-
199
-
200
-
201
-
202
-
203
-
204
-
205
-
206
-
207
-
208
 |
 |

Annual Report
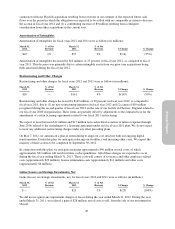
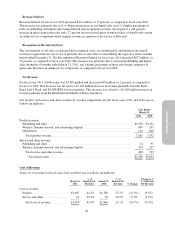
The Tax Relief, Unemployment Insurance Reauthorization, and Job Creation Act of 2010 (the “Act”) was signed
into law on December 17, 2010. The Act contains a number of provisions including, most notably, a two year
extension of the research tax credit. The Act did not have a material impact on our effective tax rate for fiscal
2012 due to the effect of the valuation allowance on our deferred tax assets.
We historically have considered undistributed earnings of our foreign subsidiaries to be indefinitely reinvested
outside of the United States and, accordingly, no U.S. taxes have been provided thereon. We currently intend to
continue to indefinitely reinvest the undistributed earnings of our foreign subsidiaries outside of the United
States.
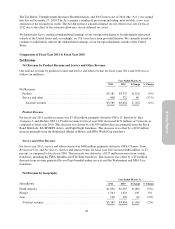
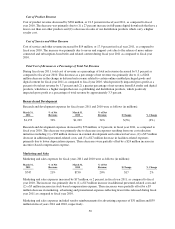
Comparison of Fiscal Year 2011 to Fiscal Year 2010
Net Revenue
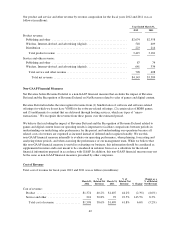
Net Revenue by Product Revenue and Service and Other Revenue
Our total net revenue by product revenue and service and other revenue for fiscal years 2011 and 2010 was as
follows (in millions):
Year Ended March 31,
2011 2010 $ Change % Change
Net Revenue:
Product ................................................ $3,181 $3,332 $(151) (5%)
Service and other ........................................ 408 322 86 (27%)
Total net revenue ...................................... $3,589 $3,654 $ (65) (2%)
Product Revenue
For fiscal year 2011, product revenue was $3,181 million, primarily driven by FIFA 11, Battlefield: Bad
Company 2, and Madden NFL 11. Product revenue for fiscal year 2011 decreased $151 million, or 5 percent, as
compared to fiscal year 2010. This decrease was driven by a $1,070 million decrease primarily from the Rock
Band, Half-Life, EA SPORTS Active, and Fight Night franchises. This decrease was offset by a $919 million
increase primarily from the Battlefield, Medal of Honor, and FIFA World Cup franchises.
Service and Other Revenue
For fiscal year 2011, service and other revenue was $408 million, primarily driven by FIFA Ultimate Team,
Restaurant City, and Pet Society. Service and other revenue for fiscal year 2011 increased $86 million, or 27
percent, as compared to fiscal year 2010. This increase was driven by a $137 million increase from certain
franchises, including the FIFA, Madden, and The Sims franchises. This increase was offset by a $51 million
decrease from revenue generated by our Pogo-branded online services and the Warhammer and NBA Live
franchises.
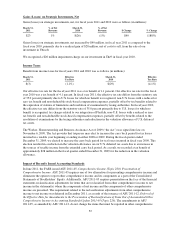
Net Revenue by Geography
Year Ended March 31,
(In millions) 2011 2010 $ Change % Change
North America ............................................ $1,836 $2,025 $(189) (9%)
Europe .................................................. 1,563 1,433 130 9%
Asia ..................................................... 190 196 (6) (3%)
Total net revenue ........................................ $3,589 $3,654 $ (65) (2%)
47