Electronic Arts 2012 Annual Report Download - page 126
Download and view the complete annual report
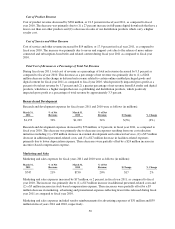
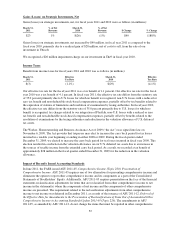
Please find page 126 of the 2012 Electronic Arts annual report below. You can navigate through the pages in the report by either clicking on the pages listed below, or by using the keyword search tool below to find specific information within the annual report.-
 1
1 -
2
-
3
-
4
-
5
-
6
-
7
-
8
-
9
-
10
-
11
-
12
-
13
-
14
-
15
-
16
-
17
-
18
-
19
-
20
-
21
-
22
-
23
-
24
-
25
-
26
-
27
-
28
-
29
-
30
-
31
-
32
-
33
-
34
-
35
-
36
-
37
-
38
-
39
-
40
-
41
-
42
-
43
-
44
-
45
-
46
-
47
-
48
-
49
-
50
-
51
-
52
-
53
-
54
-
55
-
56
-
57
-
58
-
59
-
60
-
61
-
62
-
63
-
64
-
65
-
66
-
67
-
68
-
69
-
70
-
71
-
72
-
73
-
74
-
75
-
76
-
77
-
78
-
79
-
80
-
81
-
82
-
83
-
84
-
85
-
86
-
87
-
88
-
89
-
90
-
91
-
92
-
93
-
94
-
95
-
96
-
97
-
98
-
99
-
100
-
101
-
102
-
103
-
104
-
105
-
106
-
107
-
108
-
109
-
110
-
111
-
112
-
113
-
114
-
115
-
 116
116 -
 117
117 -
 118
118 -
 119
119 -
 120
120 -
 121
121 -
 122
122 -
 123
123 -
 124
124 -
 125
125 -
 126
126 -
 127
127 -
 128
128 -
 129
129 -
 130
130 -
 131
131 -
 132
132 -
 133
133 -
 134
134 -
 135
135 -
 136
136 -
137
-
138
-
139
-
140
-
141
-
142
-
143
-
144
-
145
-
146
-
147
-
148
-
149
-
150
-
151
-
152
-
153
-
154
-
155
-
156
-
157
-
158
-
159
-
160
-
161
-
162
-
163
-
164
-
165
-
166
-
167
-
168
-
169
-
170
-
171
-
172
-
173
-
174
-
175
-
176
-
177
-
178
-
179
-
180
-
181
-
182
-
183
-
184
-
185
-
186
-
187
-
188
-
189
-
190
-
191
-
192
-
193
-
194
-
195
-
196
-
197
-
198
-
199
-
200
-
201
-
202
-
203
-
204
-
205
-
206
-
207
-
208
 |
 |

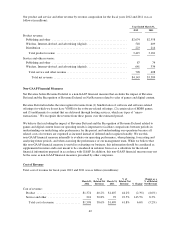
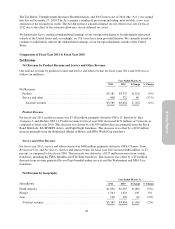
Our product and service and other revenue by revenue composition for the fiscal years 2012 and 2011 was as
follows (in millions):
Year Ended March 31,
2012 2011
Product revenue:
Publishing and other ................................................... $2,674 $2,558
Wireless, Internet-derived, and advertising (digital) ........................... 518 409
Distribution .......................................................... 223 214
Total product revenue ................................................ 3,415 3,181
Service and other revenue:
Publishing and other ................................................... 87 74
Wireless, Internet-derived, and advertising (digital) ........................... 641 334
Total service and other revenue ......................................... 728 408
Total net revenue .................................................. $4,143 $3,589
Non-GAAP Financial Measures
Net Revenue before Revenue Deferral is a non-GAAP financial measure that excludes the impact of Revenue
Deferral and the Recognition of Revenue Deferral on Net Revenue related to sales of games and digital content.
Revenue Deferral includes the unrecognized revenue from (1) bundled sales of software and software-related
offerings for which we do not have VSOE for the software-related offerings, (2) certain sales of MMO games,
and (3) entitlements to content that are delivered through hosting services, which are types of “micro-
transactions.” We recognize the revenue from these games over the estimated period.
We believe that excluding the impact of Revenue Deferral and the Recognition of Revenue Deferral related to
games and digital content from our operating results is important to facilitate comparisons between periods in
understanding our underlying sales performance for the period, and understanding our operations because all
related costs of revenues are expensed as incurred instead of deferred and recognized ratably. We use this
non-GAAP financial measure internally to evaluate our operating performance, when planning, forecasting and
analyzing future periods, and when assessing the performance of our management team. While we believe that
this non-GAAP financial measure is useful in evaluating our business, this information should be considered as
supplemental in nature and is not meant to be considered in isolation from or as a substitute for the related
financial information prepared in accordance with GAAP. In addition, this non-GAAP financial measure may not
be the same as non-GAAP financial measures presented by other companies.
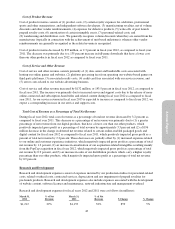
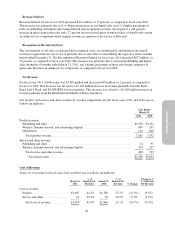
Cost of Revenue
Total cost of revenue for fiscal years 2012 and 2011 was as follows (in millions):
March 31,
2012
%of
Related Net
Revenue
March 31,
2011
%of
Related Net
Revenue % Change
Change as a
% of Related
Net Revenue
Cost of revenue:
Product .............................. $1,374 40.2% $1,407 44.2% (2.3%) (4.0%)
Service and other ...................... 224 30.8% 92 22.5% 143.5% 8.3%
Total cost of revenue ................. $1,598 38.6% $1,499 41.8% 6.6% (3.2%)
42