Electronic Arts 2012 Annual Report Download - page 191
Download and view the complete annual report
Please find page 191 of the 2012 Electronic Arts annual report below. You can navigate through the pages in the report by either clicking on the pages listed below, or by using the keyword search tool below to find specific information within the annual report.-
 1
1 -
2
-
3
-
4
-
5
-
6
-
7
-
8
-
9
-
10
-
11
-
12
-
13
-
14
-
15
-
16
-
17
-
18
-
19
-
20
-
21
-
22
-
23
-
24
-
25
-
26
-
27
-
28
-
29
-
30
-
31
-
32
-
33
-
34
-
35
-
36
-
37
-
38
-
39
-
40
-
41
-
42
-
43
-
44
-
45
-
46
-
47
-
48
-
49
-
50
-
51
-
52
-
53
-
54
-
55
-
56
-
57
-
58
-
59
-
60
-
61
-
62
-
63
-
64
-
65
-
66
-
67
-
68
-
69
-
70
-
71
-
72
-
73
-
74
-
75
-
76
-
77
-
78
-
79
-
80
-
81
-
82
-
83
-
84
-
85
-
86
-
87
-
88
-
89
-
90
-
91
-
92
-
93
-
94
-
95
-
96
-
97
-
98
-
99
-
100
-
101
-
102
-
103
-
104
-
105
-
106
-
107
-
108
-
109
-
110
-
111
-
112
-
113
-
114
-
115
-
116
-
117
-
118
-
119
-
120
-
121
-
122
-
123
-
124
-
125
-
126
-
127
-
128
-
129
-
130
-
131
-
132
-
133
-
134
-
135
-
136
-
137
-
138
-
139
-
140
-
141
-
142
-
143
-
144
-
145
-
146
-
147
-
148
-
149
-
150
-
151
-
152
-
153
-
154
-
155
-
156
-
157
-
158
-
159
-
160
-
161
-
162
-
163
-
164
-
165
-
166
-
167
-
168
-
169
-
170
-
171
-
172
-
173
-
174
-
175
-
176
-
177
-
178
-
179
-
180
-
 181
181 -
 182
182 -
 183
183 -
 184
184 -
 185
185 -
 186
186 -
 187
187 -
 188
188 -
 189
189 -
 190
190 -
 191
191 -
 192
192 -
 193
193 -
 194
194 -
 195
195 -
 196
196 -
 197
197 -
 198
198 -
 199
199 -
 200
200 -
 201
201 -
202
-
203
-
204
-
205
-
206
-
207
-
208
 |
 |

Annual Report
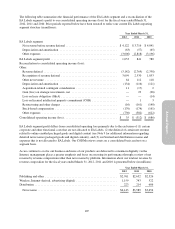
The following table summarizes the financial performance of the EA Labels segment and a reconciliation of the
EA Labels segment’s profit to our consolidated operating income (loss) for the fiscal years ended March 31,
2012, 2011 and 2010. Prior periods reported below have been restated to reflect our current EA Labels reporting
segment structure (in millions):
Year Ended March 31,
2012 2011 2010
EA Labels segment:
Net revenue before revenue deferral ................................... $4,122 $ 3,716 $ 4,041
Depreciation and amortization ....................................... (63) (57) (65)
Other expenses ................................................... (3,006) (2,818) (3,196)
EA Labels segment profit ............................................. 1,053 841 780
Reconciliation to consolidated operating income (loss):
Other:
Revenue deferral .................................................. (3,142) (2,769) (2,358)
Recognition of revenue deferral ...................................... 3,099 2,530 1,853
Other net revenue ................................................. 64 112 118
Depreciation and amortization ....................................... (134) (116) (121)
Acquisition-related contingent consideration ............................ 11 (17) 2
Gain (loss) on strategic investments, net ............................... — 23 (26)
Loss on lease obligation (G&A) ...................................... — — (14)
Loss on licensed intellectual property commitment (COR) ................. — 1 3
Restructuring and other charges ...................................... (16) (161) (140)
Stock-based compensation .......................................... (170) (174) (161)
Other expenses ................................................... (730) (582) (622)
Consolidated operating income (loss) .................................... $ 35 $ (312) $ (686)
EA Labels segment profit differs from consolidated operating loss primarily due to the exclusion of (1) certain
corporate and other functional costs that are not allocated to EA Labels, (2) the deferral of certain net revenue
related to online-enabled packaged goods and digital content (see Note 9 for additional information regarding
deferred net revenue (packaged goods and digital content)), and (3) our Switzerland distribution revenue and
expenses that is not allocated to EA Labels. Our CODM reviews assets on a consolidated basis and not on a
segment basis.
As we continue to evolve our business and more of our products are delivered to consumers digitally via the
Internet, management places a greater emphasis and focus on assessing its performance through a review of net
revenue by revenue composition rather than net revenue by platform. Information about our total net revenue by
revenue composition for the fiscal years ended March 31, 2012, 2011 and 2010 is presented below (in millions):
Year Ended March 31,
2012 2011 2010
Publishing and other ................................................. $2,761 $2,632 $2,526
Wireless, Internet-derived, advertising (digital) ............................ 1,159 743 522
Distribution ........................................................ 223 214 606
Net revenue ...................................................... $4,143 $3,589 $3,654
107