Electronic Arts 2012 Annual Report Download - page 161
Download and view the complete annual report
Please find page 161 of the 2012 Electronic Arts annual report below. You can navigate through the pages in the report by either clicking on the pages listed below, or by using the keyword search tool below to find specific information within the annual report.-
 1
1 -
2
-
3
-
4
-
5
-
6
-
7
-
8
-
9
-
10
-
11
-
12
-
13
-
14
-
15
-
16
-
17
-
18
-
19
-
20
-
21
-
22
-
23
-
24
-
25
-
26
-
27
-
28
-
29
-
30
-
31
-
32
-
33
-
34
-
35
-
36
-
37
-
38
-
39
-
40
-
41
-
42
-
43
-
44
-
45
-
46
-
47
-
48
-
49
-
50
-
51
-
52
-
53
-
54
-
55
-
56
-
57
-
58
-
59
-
60
-
61
-
62
-
63
-
64
-
65
-
66
-
67
-
68
-
69
-
70
-
71
-
72
-
73
-
74
-
75
-
76
-
77
-
78
-
79
-
80
-
81
-
82
-
83
-
84
-
85
-
86
-
87
-
88
-
89
-
90
-
91
-
92
-
93
-
94
-
95
-
96
-
97
-
98
-
99
-
100
-
101
-
102
-
103
-
104
-
105
-
106
-
107
-
108
-
109
-
110
-
111
-
112
-
113
-
114
-
115
-
116
-
117
-
118
-
119
-
120
-
121
-
122
-
123
-
124
-
125
-
126
-
127
-
128
-
129
-
130
-
131
-
132
-
133
-
134
-
135
-
136
-
137
-
138
-
139
-
140
-
141
-
142
-
143
-
144
-
145
-
146
-
147
-
148
-
149
-
150
-
 151
151 -
 152
152 -
 153
153 -
 154
154 -
 155
155 -
 156
156 -
 157
157 -
 158
158 -
 159
159 -
 160
160 -
 161
161 -
 162
162 -
 163
163 -
 164
164 -
 165
165 -
 166
166 -
 167
167 -
 168
168 -
 169
169 -
 170
170 -
 171
171 -
172
-
173
-
174
-
175
-
176
-
177
-
178
-
179
-
180
-
181
-
182
-
183
-
184
-
185
-
186
-
187
-
188
-
189
-
190
-
191
-
192
-
193
-
194
-
195
-
196
-
197
-
198
-
199
-
200
-
201
-
202
-
203
-
204
-
205
-
206
-
207
-
208
 |
 |

Annual Report
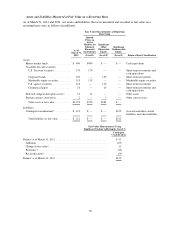
Fair Value Measurements at Reporting
Date Using
As of
March 31,
2011
Quoted Prices
in Active
Markets for
Identical
Financial
Instruments
Significant
Other
Observable
Inputs
Significant
Unobservable
Inputs
(Level 1) (Level 2) (Level 3) Balance Sheet Classification
Assets
Money market funds .................. $ 774 $ 774 $ — $— Cash equivalents
Available-for-sale securities:
Corporate bonds ................... 253 — 253 — Short-term investments
Marketable equity securities .......... 161 161 — — Marketable equity securities
U.S. Treasury securities ............. 129 129 — — Short-term investments and
cash equivalents
U.S. agency securities ............... 102 — 102 — Short-term investments
Commercial paper .................. 31 — 31 — Short-term investments and
cash equivalents
Deferred compensation plan assets (a) ..... 12 12 — — Other assets
Total assets at fair value ............. $1,462 $1,076 $386 $ —
Liability
Contingent consideration (b) ............ $ 51 $ — $ — $51 Accrued and other current
liabilities and other liabilities
Total liability at fair value ........... $ 51 $ — $ — $51
Fair Value Measurements Using
Significant Unobservable Inputs (Level 3)
Contingent
Consideration
Balance as of March 31, 2010 ....................................... $65
Additions ..................................................... 3
Change in fair value (c) ........................................... (17)
Balance as of March 31, 2011 ....................................... $51
(a) The deferred compensation plan assets consist of various mutual funds.
(b) The contingent consideration as of March 31, 2012 represents the estimated fair value of the additional
variable cash consideration payable primarily in connection with our acquisitions of PopCap Games, Inc.
(“PopCap”), KlickNation Corporation (“KlickNation”), and Chillingo Limited (“Chillingo”) that is contingent
upon the achievement of certain performance milestones. The contingent consideration as of March 31, 2011
represents the estimated fair value of the additional variable cash consideration payable primarily in connection
with our acquisitions of Playfish Limited (“Playfish”) and Chillingo that is contingent upon the achievement of
certain performance milestones. We estimated the fair value of the acquisition-related contingent consideration
payable using probability-weighted discounted cash flow models, and applied a discount rate that appropriately
captures a market participant’s view of the risk associated with the obligations. During the fiscal year 2012, the
discount rate used had a weighted average of 12 percent. During the fiscal year 2011, the discount rate used
had a weighted average of 12 percent. The significant unobservable input used in the fair value measurement
of the acquisition-related contingent consideration payable are forecasted earnings. Significant changes in
forecasted earnings would result in a significantly higher or lower fair value measurement. At March 31, 2012
and 2011, the fair market value of acquisition-related contingent consideration totaled $112 million and $51
million, respectively, compared to a maximum potential payout of $572 million and $110 million, respectively.
(c) The change in fair value is reported as acquisition-related contingent consideration in our Consolidated
Statements of Operations.
77