Electronic Arts 2012 Annual Report Download - page 47
Download and view the complete annual report
Please find page 47 of the 2012 Electronic Arts annual report below. You can navigate through the pages in the report by either clicking on the pages listed below, or by using the keyword search tool below to find specific information within the annual report.-
 1
1 -
2
-
3
-
4
-
5
-
6
-
7
-
8
-
9
-
10
-
11
-
12
-
13
-
14
-
15
-
16
-
17
-
18
-
19
-
20
-
21
-
22
-
23
-
24
-
25
-
26
-
27
-
28
-
29
-
30
-
31
-
32
-
33
-
34
-
35
-
36
-
 37
37 -
 38
38 -
 39
39 -
 40
40 -
 41
41 -
 42
42 -
 43
43 -
 44
44 -
 45
45 -
 46
46 -
 47
47 -
 48
48 -
 49
49 -
 50
50 -
 51
51 -
 52
52 -
 53
53 -
 54
54 -
 55
55 -
 56
56 -
 57
57 -
58
-
59
-
60
-
61
-
62
-
63
-
64
-
65
-
66
-
67
-
68
-
69
-
70
-
71
-
72
-
73
-
74
-
75
-
76
-
77
-
78
-
79
-
80
-
81
-
82
-
83
-
84
-
85
-
86
-
87
-
88
-
89
-
90
-
91
-
92
-
93
-
94
-
95
-
96
-
97
-
98
-
99
-
100
-
101
-
102
-
103
-
104
-
105
-
106
-
107
-
108
-
109
-
110
-
111
-
112
-
113
-
114
-
115
-
116
-
117
-
118
-
119
-
120
-
121
-
122
-
123
-
124
-
125
-
126
-
127
-
128
-
129
-
130
-
131
-
132
-
133
-
134
-
135
-
136
-
137
-
138
-
139
-
140
-
141
-
142
-
143
-
144
-
145
-
146
-
147
-
148
-
149
-
150
-
151
-
152
-
153
-
154
-
155
-
156
-
157
-
158
-
159
-
160
-
161
-
162
-
163
-
164
-
165
-
166
-
167
-
168
-
169
-
170
-
171
-
172
-
173
-
174
-
175
-
176
-
177
-
178
-
179
-
180
-
181
-
182
-
183
-
184
-
185
-
186
-
187
-
188
-
189
-
190
-
191
-
192
-
193
-
194
-
195
-
196
-
197
-
198
-
199
-
200
-
201
-
202
-
203
-
204
-
205
-
206
-
207
-
208
 |
 |

Proxy Statement
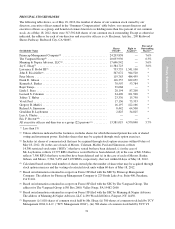
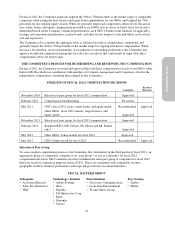
Additional Factors Impacting Equity Award Size
When considering the value of equity to be granted to our NEOs, the Committee also evaluates:
1. The grant date fair value of the awards (as reported in the “Summary Compensation” table);
2. The value of the awards as determined by multiplying the target number of shares granted by the closing
stock price on the date of grant; and
3. The actual value our NEOs received in a fiscal year from the vesting of prior equity awards.
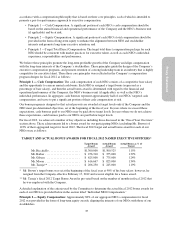
For example, the following table shows the different valuations of our CEO’s fiscal 2012 compensation
(excluding all other compensation) when applying each of these methods:
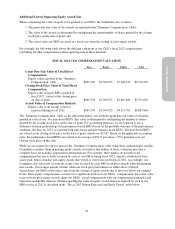
FISCAL 2012 CEO COMPENSATION VALUATION
Base Bonus Equity Total
Grant Date Fair Value of Total Direct
Compensation
Equity values reported in the “Summary
Compensation” table ............... $865,538 $1,500,525 $7,148,332 $9,514,395
Closing Stock Price Value of Total Direct
Compensation
Equity value of target RSUs granted in
fiscal 2012, valued at the closing price
on date of grant .................... $865,538 $1,500,525 $5,605,000 $7,971,063
Actual Value of Compensation Realized
Equity value of all awards vested or
exercised during fiscal 2012 .......... $865,538 $1,500,525 $4,521,781 $6,887,844
The “Summary Compensation” table, in the tables that follow, sets forth the grant date fair value of all equity
granted in a fiscal year. For time-based RSUs, this value is determined by multiplying the number of shares
granted by the closing stock price on the date of grant. For accounting purposes, we are required to use a
different valuation methodology for performance-based RSUs based on the probable outcome of the performance
condition. On June 16, 2011, we granted both time-based and performance-based RSUs. The time-based RSUs
are valued at our closing stock price on the date of grant, which was $22.42. Based on the applicable accounting
rules, the performance-based RSUs are valued at an average of $34.77 per share, a 55% premium over our
closing stock price on this date.
While we are required to report values in the “Summary Compensation” table using those methodologies and the
Committee considers them in making equity awards, we believe that neither of those valuations provides a
complete basis for making compensation determinations. For example, these metrics do not reflect the
compensation that was actually received by each of our NEOs during fiscal 2012, which is attributed to base
salary paid, bonus awarded, and equity awards that vested or were exercised in fiscal 2012. Accordingly, our
Committee also takes into account the actual value received by each NEO from prior awards when determining
new awards. Over longer periods of time, when our stock price performance is either above or below
expectations, our NEOs will realize value from the vesting of equity awards that is above or below our targeted
levels. Since equity compensation accounts for a significant portion of our NEOs’ compensation, the actual value
received from prior equity awards aligns our NEOs’ actual compensation with our compensation principles and
long term stockholder interests. Details regarding the value of equity awards that was realized by each of our
NEOs in fiscal 2012 is described in the “Fiscal 2012 Option Exercised and Stock Vested” table below.
39