Electronic Arts 2012 Annual Report Download - page 64
Download and view the complete annual report
Please find page 64 of the 2012 Electronic Arts annual report below. You can navigate through the pages in the report by either clicking on the pages listed below, or by using the keyword search tool below to find specific information within the annual report.-
 1
1 -
2
-
3
-
4
-
5
-
6
-
7
-
8
-
9
-
10
-
11
-
12
-
13
-
14
-
15
-
16
-
17
-
18
-
19
-
20
-
21
-
22
-
23
-
24
-
25
-
26
-
27
-
28
-
29
-
30
-
31
-
32
-
33
-
34
-
35
-
36
-
37
-
38
-
39
-
40
-
41
-
42
-
43
-
44
-
45
-
46
-
47
-
48
-
49
-
50
-
51
-
52
-
53
-
 54
54 -
 55
55 -
 56
56 -
 57
57 -
 58
58 -
 59
59 -
 60
60 -
 61
61 -
 62
62 -
 63
63 -
 64
64 -
 65
65 -
 66
66 -
 67
67 -
 68
68 -
 69
69 -
 70
70 -
 71
71 -
 72
72 -
 73
73 -
 74
74 -
75
-
76
-
77
-
78
-
79
-
80
-
81
-
82
-
83
-
84
-
85
-
86
-
87
-
88
-
89
-
90
-
91
-
92
-
93
-
94
-
95
-
96
-
97
-
98
-
99
-
100
-
101
-
102
-
103
-
104
-
105
-
106
-
107
-
108
-
109
-
110
-
111
-
112
-
113
-
114
-
115
-
116
-
117
-
118
-
119
-
120
-
121
-
122
-
123
-
124
-
125
-
126
-
127
-
128
-
129
-
130
-
131
-
132
-
133
-
134
-
135
-
136
-
137
-
138
-
139
-
140
-
141
-
142
-
143
-
144
-
145
-
146
-
147
-
148
-
149
-
150
-
151
-
152
-
153
-
154
-
155
-
156
-
157
-
158
-
159
-
160
-
161
-
162
-
163
-
164
-
165
-
166
-
167
-
168
-
169
-
170
-
171
-
172
-
173
-
174
-
175
-
176
-
177
-
178
-
179
-
180
-
181
-
182
-
183
-
184
-
185
-
186
-
187
-
188
-
189
-
190
-
191
-
192
-
193
-
194
-
195
-
196
-
197
-
198
-
199
-
200
-
201
-
202
-
203
-
204
-
205
-
206
-
207
-
208
 |
 |
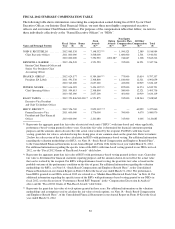
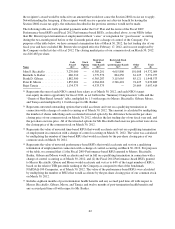
measurement periods. TSR is determined based on a 90-day trailing average of the closing stock prices of the
NASDAQ-100 at the end of each measurement period as compared to the 90-day trailing average of the
closing stock prices of the NASDAQ-100 at the beginning of the measurement period. For each measurement
period, the Company’s TSR must be at the 60th percentile of the TSR of companies in the NASDAQ-100 in
order for 100% of the target award to vest. This requires the Company to outperform the majority of
companies in the NASDAQ-100 for the targeted number of shares to vest. If our TSR is above or below the
60th percentile, the number of shares that vest will increase by 3% for each percentile above the 60th,or
decrease by 2% for each percentile below the 60th. Upon vesting, each restricted stock unit is converted to one
share of EA common stock, and does not have an exercise price or expiration date. The RSUs are not entitled
to receive dividends, if any, paid by EA on its common stock. There is no threshold level for this award.
(4) Represents awards of RSUs with time-based vesting granted under our 2000 Equity Incentive Plan. Upon
vesting, each restricted stock unit automatically converts into one share of EA common stock, and does not
have an exercise price or expiration date. The RSUs are not entitled to receive dividends, if any, paid by EA
on its common stock.
(5) For grants of RSUs with time-based vesting, represents the aggregate grant date fair value of RSUs calculated
using the closing price of our common stock on the date of grant. For grants of RSUs with performance-based
vesting, represents the aggregate grant date fair value of the award based on the probable outcome of the
performance condition on the date of grant. Grant date fair value is determined for financial statement
reporting purposes and the amounts shown do not reflect actual value realized by the recipient. For a more
detailed discussion of the valuation methodology and assumptions used to calculate fair value, see Note 14,
“Stock-Based Compensation and Employee Benefit Plans”, of the Consolidated Financial Statements in our
Annual Report on Form 10-K for the fiscal year ended March 31, 2012. For additional information regarding
the specific terms of the RSUs with performance-based vesting granted to our NEOs in fiscal 2012, see the
discussion of “Performance-Based RSU Program” in the “Compensation Discussion & Analysis” above.
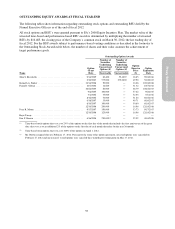
(6) RSUs vest as to one-third of the units 11 months from the grant date, then vest as to an additional one-third of
the units 23 months from the grant date and the remaining one-third of the units 35 months from the grant
date.
(7) RSUs vest as to one-half of the units 12 months from the grant date and then vest as to the remaining one-half
of the units 24 months from the grant date.
(8) RSUs vest as to one-fourth of the units six months from the grant date, then vest as to an additional one-fourth
of the units 12 months from the grant date, an additional one-fourth of the units 24 months from the grant date
and the remaining one-fourth of the units 36 months from the grant date.
(9) RSUs vest as to 100% of the units 12 months from the grant date.
(10) Mr. Brown resigned effective February 17, 2012. He was not eligible to receive a cash bonus plan award for
fiscal 2012 and all unvested equity awards were cancelled on February 17, 2012.
56