Electronic Arts 2012 Annual Report Download - page 60
Download and view the complete annual report
Please find page 60 of the 2012 Electronic Arts annual report below. You can navigate through the pages in the report by either clicking on the pages listed below, or by using the keyword search tool below to find specific information within the annual report.-
 1
1 -
2
-
3
-
4
-
5
-
6
-
7
-
8
-
9
-
10
-
11
-
12
-
13
-
14
-
15
-
16
-
17
-
18
-
19
-
20
-
21
-
22
-
23
-
24
-
25
-
26
-
27
-
28
-
29
-
30
-
31
-
32
-
33
-
34
-
35
-
36
-
37
-
38
-
39
-
40
-
41
-
42
-
43
-
44
-
45
-
46
-
47
-
48
-
49
-
 50
50 -
 51
51 -
 52
52 -
 53
53 -
 54
54 -
 55
55 -
 56
56 -
 57
57 -
 58
58 -
 59
59 -
 60
60 -
 61
61 -
 62
62 -
 63
63 -
 64
64 -
 65
65 -
 66
66 -
 67
67 -
 68
68 -
 69
69 -
 70
70 -
71
-
72
-
73
-
74
-
75
-
76
-
77
-
78
-
79
-
80
-
81
-
82
-
83
-
84
-
85
-
86
-
87
-
88
-
89
-
90
-
91
-
92
-
93
-
94
-
95
-
96
-
97
-
98
-
99
-
100
-
101
-
102
-
103
-
104
-
105
-
106
-
107
-
108
-
109
-
110
-
111
-
112
-
113
-
114
-
115
-
116
-
117
-
118
-
119
-
120
-
121
-
122
-
123
-
124
-
125
-
126
-
127
-
128
-
129
-
130
-
131
-
132
-
133
-
134
-
135
-
136
-
137
-
138
-
139
-
140
-
141
-
142
-
143
-
144
-
145
-
146
-
147
-
148
-
149
-
150
-
151
-
152
-
153
-
154
-
155
-
156
-
157
-
158
-
159
-
160
-
161
-
162
-
163
-
164
-
165
-
166
-
167
-
168
-
169
-
170
-
171
-
172
-
173
-
174
-
175
-
176
-
177
-
178
-
179
-
180
-
181
-
182
-
183
-
184
-
185
-
186
-
187
-
188
-
189
-
190
-
191
-
192
-
193
-
194
-
195
-
196
-
197
-
198
-
199
-
200
-
201
-
202
-
203
-
204
-
205
-
206
-
207
-
208
 |
 |

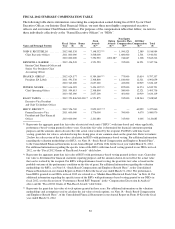
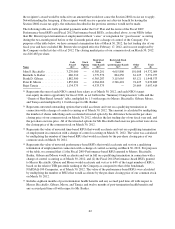
FISCAL 2012 SUMMARY COMPENSATION TABLE
The following table shows information concerning the compensation earned during fiscal 2012 by our Chief
Executive Officer, our Interim Chief Financial Officer, our next three most highly compensated executive
officers and our former Chief Financial Officer. For purposes of the compensation tables that follow, we refer to
these individuals collectively as the “Named Executive Officers” or “NEOs”.
Name and Principal Position
Fiscal
Year
Salary
($)
Bonus
($)
Stock
Awards
($)(1)
Option
Awards
($)(3)
Non-Equity
Incentive Plan
Compensation
($)(4)
All Other
Compensation
($)(5)
Total
($)
JOHN S. RICCITIELLO .......... 2012 865,538 — 7,148,332(2)(6) — 1,500,525 2,589 9,516,984
Chief Executive Officer 2011 800,000 — 3,508,000 — 1,600,000 2,501 5,910,501
2010 800,000 — 7,294,950 1,002,287 746,667 1,308 9,845,212
KENNETH A. BARKER .......... 2012 426,945 — 1,551,550 — 355,000 14,221 2,347,716
Interim Chief Financial Officer and
Senior Vice President, Chief
Accounting Officer
FRANK D. GIBEAU ............. 2012 624,577 — 8,384,166(2)(7) — 775,000 13,614 9,797,357
President, EA Labels 2011 591,538 — 2,308,800 — 1,180,000 12,321 4,092,659
2010 545,000 — 2,657,200 — 423,000 10,919 3,636,119
PETER R. MOORE .............. 2012 616,385 — 5,494,132(2)(8) — 825,000 14,274 6,949,791
Chief Operating Officer 2011 594,615 — 2,308,800 — 580,000 12,321 3,495,736
2010 565,000 — 2,657,200 — 401,000 10,919 3,634,119
RAJAT TANEJA ................ 2012 253,846 500,000 (9) 6,551,875 — 245,000 108,244 7,658,965
Executive Vice President
and Chief Technology Officer
ERIC F. BROWN(10) .............. 2012 556,769 — 2,859,332(2)(11) — — 60,959 3,477,060
Former Executive Vice 2011 600,000 — 1,776,000 — 700,000 4,070 3,080,070
President and Chief Financial
Officer 2010 600,000 — 2,201,680 — 315,000 4,005 3,120,685
(1) Represents the aggregate grant date fair value of restricted stock units (“RSUs”) with time-based and, where applicable,
performance-based vesting granted in those years. Grant date fair value is determined for financial statement reporting
purposes and the amounts shown do not reflect the actual value realized by the recipient. For RSUs with time-based
vesting, grant date fair value is calculated using the closing price of our common stock on the grant date. Refer to footnote
2 below for a discussion of the fair value calculation for RSUs with performance-based vesting. For additional information
regarding the valuation methodology for RSUs, see Note 14, “Stock-Based Compensation and Employee Benefit Plans”,
to the Consolidated Financial Statements in our Annual Report on Form 10-K for the fiscal year ended March 31, 2012.
For additional information regarding the specific terms of the RSUs with time-based vesting granted to our NEOs in fiscal
2012, see the “Fiscal 2012 Grants of Plan-Based Awards” table below.
(2) Represents the aggregate grant date fair value of RSUs with performance-based vesting granted in those years. Grant date
fair value is determined for financial statement reporting purposes and the amounts shown do not reflect the actual value
that can be realized by the recipient. For RSUs with performance-based vesting, the grant date fair value is based on the
probable outcome of the performance condition on the date of grant. For additional information regarding the valuation
methodology for RSUs, see Note 14, “Stock-Based Compensation and Employee Benefit Plans”, to the Consolidated
Financial Statements in our Annual Report on Form 10-K for the fiscal year ended March 31, 2012. The performance-
based RSUs granted to our NEOs in fiscal 2012 are referred to as “Market-Based Restricted Stock Units” in Note 14. For
additional information regarding the specific terms of the RSUs with performance-based vesting granted to our NEOs in
fiscal 2012, see the discussion of “Performance-Based RSU Program” in the “Compensation Discussion & Analysis”
above and the “Fiscal 2012 Grants of Plan-Based Awards” table below.
(3) Represents the grant date fair value of stock options granted in those years. For additional information on the valuation
methodology and assumptions used to calculate the fair value of stock options, see Note 14, “Stock-Based Compensation
and Employee Benefit Plans”, of the Consolidated Financial Statements in our Annual Report on Form 10-K for the fiscal
year ended March 31, 2012.
52