Electronic Arts 2012 Annual Report Download - page 148
Download and view the complete annual report
Please find page 148 of the 2012 Electronic Arts annual report below. You can navigate through the pages in the report by either clicking on the pages listed below, or by using the keyword search tool below to find specific information within the annual report.-
 1
1 -
2
-
3
-
4
-
5
-
6
-
7
-
8
-
9
-
10
-
11
-
12
-
13
-
14
-
15
-
16
-
17
-
18
-
19
-
20
-
21
-
22
-
23
-
24
-
25
-
26
-
27
-
28
-
29
-
30
-
31
-
32
-
33
-
34
-
35
-
36
-
37
-
38
-
39
-
40
-
41
-
42
-
43
-
44
-
45
-
46
-
47
-
48
-
49
-
50
-
51
-
52
-
53
-
54
-
55
-
56
-
57
-
58
-
59
-
60
-
61
-
62
-
63
-
64
-
65
-
66
-
67
-
68
-
69
-
70
-
71
-
72
-
73
-
74
-
75
-
76
-
77
-
78
-
79
-
80
-
81
-
82
-
83
-
84
-
85
-
86
-
87
-
88
-
89
-
90
-
91
-
92
-
93
-
94
-
95
-
96
-
97
-
98
-
99
-
100
-
101
-
102
-
103
-
104
-
105
-
106
-
107
-
108
-
109
-
110
-
111
-
112
-
113
-
114
-
115
-
116
-
117
-
118
-
119
-
120
-
121
-
122
-
123
-
124
-
125
-
126
-
127
-
128
-
129
-
130
-
131
-
132
-
133
-
134
-
135
-
136
-
137
-
 138
138 -
 139
139 -
 140
140 -
 141
141 -
 142
142 -
 143
143 -
 144
144 -
 145
145 -
 146
146 -
 147
147 -
 148
148 -
 149
149 -
 150
150 -
 151
151 -
 152
152 -
 153
153 -
 154
154 -
 155
155 -
 156
156 -
 157
157 -
 158
158 -
159
-
160
-
161
-
162
-
163
-
164
-
165
-
166
-
167
-
168
-
169
-
170
-
171
-
172
-
173
-
174
-
175
-
176
-
177
-
178
-
179
-
180
-
181
-
182
-
183
-
184
-
185
-
186
-
187
-
188
-
189
-
190
-
191
-
192
-
193
-
194
-
195
-
196
-
197
-
198
-
199
-
200
-
201
-
202
-
203
-
204
-
205
-
206
-
207
-
208
 |
 |

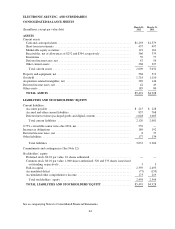
ELECTRONIC ARTS INC. AND SUBSIDIARIES
CONSOLIDATED BALANCE SHEETS
(In millions, except par value data) March 31,
2012
March 31,
2011
ASSETS
Current assets:
Cash and cash equivalents .................................................. $1,293 $1,579
Short-term investments .................................................... 437 497
Marketable equity securities ................................................ 119 161
Receivables, net of allowances of $252 and $304, respectively ..................... 366 335
Inventories .............................................................. 59 77
Deferred income taxes, net ................................................. 67 56
Other current assets ....................................................... 268 327
Total current assets ..................................................... 2,609 3,032
Property and equipment, net .................................................. 568 513
Goodwill ................................................................. 1,718 1,110
Acquisition-related intangibles, net ............................................ 369 144
Deferred income taxes, net ................................................... 42 49
Other assets ............................................................... 185 80
TOTAL ASSETS ........................................................ $5,491 $4,928
LIABILITIES AND STOCKHOLDERS’ EQUITY
Current liabilities:
Accounts payable ........................................................ $ 215 $ 228
Accrued and other current liabilities .......................................... 857 768
Deferred net revenue (packaged goods and digital content) ........................ 1,048 1,005
Total current liabilities .................................................. 2,120 2,001
0.75% convertible senior notes due 2016, net ..................................... 539 —
Income tax obligations ...................................................... 189 192
Deferred income taxes, net ................................................... 8 37
Other liabilities ............................................................ 177 134
Total liabilities ........................................................ 3,033 2,364
Commitments and contingencies (See Note 12)
Stockholders’ equity:
Preferred stock, $0.01 par value. 10 shares authorized ............................ — —
Common stock, $0.01 par value. 1,000 shares authorized; 320 and 333 shares issued and
outstanding, respectively ................................................. 3 3
Paid-in capital ........................................................... 2,359 2,495
Accumulated deficit ...................................................... (77) (153)
Accumulated other comprehensive income .................................... 173 219
Total stockholders’ equity ................................................ 2,458 2,564
TOTAL LIABILITIES AND STOCKHOLDERS’ EQUITY .................... $5,491 $4,928
See accompanying Notes to Consolidated Financial Statements.
64