Electronic Arts 2012 Annual Report Download - page 189
Download and view the complete annual report
Please find page 189 of the 2012 Electronic Arts annual report below. You can navigate through the pages in the report by either clicking on the pages listed below, or by using the keyword search tool below to find specific information within the annual report.-
 1
1 -
2
-
3
-
4
-
5
-
6
-
7
-
8
-
9
-
10
-
11
-
12
-
13
-
14
-
15
-
16
-
17
-
18
-
19
-
20
-
21
-
22
-
23
-
24
-
25
-
26
-
27
-
28
-
29
-
30
-
31
-
32
-
33
-
34
-
35
-
36
-
37
-
38
-
39
-
40
-
41
-
42
-
43
-
44
-
45
-
46
-
47
-
48
-
49
-
50
-
51
-
52
-
53
-
54
-
55
-
56
-
57
-
58
-
59
-
60
-
61
-
62
-
63
-
64
-
65
-
66
-
67
-
68
-
69
-
70
-
71
-
72
-
73
-
74
-
75
-
76
-
77
-
78
-
79
-
80
-
81
-
82
-
83
-
84
-
85
-
86
-
87
-
88
-
89
-
90
-
91
-
92
-
93
-
94
-
95
-
96
-
97
-
98
-
99
-
100
-
101
-
102
-
103
-
104
-
105
-
106
-
107
-
108
-
109
-
110
-
111
-
112
-
113
-
114
-
115
-
116
-
117
-
118
-
119
-
120
-
121
-
122
-
123
-
124
-
125
-
126
-
127
-
128
-
129
-
130
-
131
-
132
-
133
-
134
-
135
-
136
-
137
-
138
-
139
-
140
-
141
-
142
-
143
-
144
-
145
-
146
-
147
-
148
-
149
-
150
-
151
-
152
-
153
-
154
-
155
-
156
-
157
-
158
-
159
-
160
-
161
-
162
-
163
-
164
-
165
-
166
-
167
-
168
-
169
-
170
-
171
-
172
-
173
-
174
-
175
-
176
-
177
-
178
-
 179
179 -
 180
180 -
 181
181 -
 182
182 -
 183
183 -
 184
184 -
 185
185 -
 186
186 -
 187
187 -
 188
188 -
 189
189 -
 190
190 -
 191
191 -
 192
192 -
 193
193 -
 194
194 -
 195
195 -
 196
196 -
 197
197 -
 198
198 -
 199
199 -
200
-
201
-
202
-
203
-
204
-
205
-
206
-
207
-
208
 |
 |

Annual Report
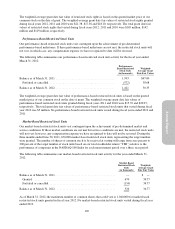
The change in the components of accumulated other comprehensive income, net of related immaterial taxes, is
summarized as follows (in millions):
Foreign
Currency
Translation
Adjustments
Unrealized
Gains
(Losses) on
Available-for-
sale Securities
Unrealized
Gains
(Losses) on
Derivative
Instruments
Accumulated
Other
Comprehensive
Income
Balances as of March 31, 2009 ..................... (3) 191 1 189
Other comprehensive income (loss) ................. 73 (33) (1) 39
Balances as of March 31, 2010 ..................... 70 158 — 228
Other comprehensive income (loss) ................. 25 (32) (2) (9)
Balances as of March 31, 2011 ..................... 95 126 (2) 219
Other comprehensive loss ......................... (4) (42) — (46)
Balances as of March 31, 2012 ..................... $91 $ 84 $(2) $173
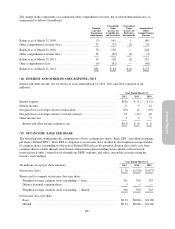
(16) INTEREST AND OTHER INCOME (EXPENSE), NET
Interest and other income, net, for the fiscal years ended March 31, 2012, 2011 and 2010 consisted of (in
millions):
Year Ended March 31,
2012 2011 2010
Interest expense ..................................................... $(20) $ (1) $ (2)
Interest income ..................................................... 9 9 12
Net gain (loss) on foreign currency transactions ........................... (29) 12 (19)
Net gain (loss) on foreign currency forward contracts ....................... 21 (12) 10
Other income, net ................................................... 2 2 5
Interest and other income (expense), net ............................... $(17) $ 10 $ 6
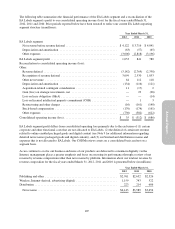
(17) NET INCOME (LOSS) PER SHARE
The following table summarizes the computations of basic earnings per share (“Basic EPS”) and diluted earnings
per share (“Diluted EPS”). Basic EPS is computed as net income (loss) divided by the weighted-average number
of common shares outstanding for the period. Diluted EPS reflects the potential dilution that could occur from
common shares issuable through stock-based compensation plans including stock options, restricted stock,
restricted stock units, common stock through our ESPP, warrants, and other convertible securities using the
treasury stock method.
Year Ended March 31,
(In millions, except per share amounts) 2012 2011 2010
Net income (loss) ................................................... $ 76 $(276) $ (677)
Shares used to compute net income (loss) per share:
Weighted-average common stock outstanding — basic .................... 331 330 325
Dilutive potential common shares .................................... 5 — —
Weighted-average common stock outstanding — diluted .................. 336 330 325
Net income (loss) per share:
Basic ........................................................... $0.23 $(0.84) $(2.08)
Diluted ......................................................... $0.23 $(0.84) $(2.08)
105