Electronic Arts 2012 Annual Report Download - page 190
Download and view the complete annual report
Please find page 190 of the 2012 Electronic Arts annual report below. You can navigate through the pages in the report by either clicking on the pages listed below, or by using the keyword search tool below to find specific information within the annual report.-
 1
1 -
2
-
3
-
4
-
5
-
6
-
7
-
8
-
9
-
10
-
11
-
12
-
13
-
14
-
15
-
16
-
17
-
18
-
19
-
20
-
21
-
22
-
23
-
24
-
25
-
26
-
27
-
28
-
29
-
30
-
31
-
32
-
33
-
34
-
35
-
36
-
37
-
38
-
39
-
40
-
41
-
42
-
43
-
44
-
45
-
46
-
47
-
48
-
49
-
50
-
51
-
52
-
53
-
54
-
55
-
56
-
57
-
58
-
59
-
60
-
61
-
62
-
63
-
64
-
65
-
66
-
67
-
68
-
69
-
70
-
71
-
72
-
73
-
74
-
75
-
76
-
77
-
78
-
79
-
80
-
81
-
82
-
83
-
84
-
85
-
86
-
87
-
88
-
89
-
90
-
91
-
92
-
93
-
94
-
95
-
96
-
97
-
98
-
99
-
100
-
101
-
102
-
103
-
104
-
105
-
106
-
107
-
108
-
109
-
110
-
111
-
112
-
113
-
114
-
115
-
116
-
117
-
118
-
119
-
120
-
121
-
122
-
123
-
124
-
125
-
126
-
127
-
128
-
129
-
130
-
131
-
132
-
133
-
134
-
135
-
136
-
137
-
138
-
139
-
140
-
141
-
142
-
143
-
144
-
145
-
146
-
147
-
148
-
149
-
150
-
151
-
152
-
153
-
154
-
155
-
156
-
157
-
158
-
159
-
160
-
161
-
162
-
163
-
164
-
165
-
166
-
167
-
168
-
169
-
170
-
171
-
172
-
173
-
174
-
175
-
176
-
177
-
178
-
179
-
 180
180 -
 181
181 -
 182
182 -
 183
183 -
 184
184 -
 185
185 -
 186
186 -
 187
187 -
 188
188 -
 189
189 -
 190
190 -
 191
191 -
 192
192 -
 193
193 -
 194
194 -
 195
195 -
 196
196 -
 197
197 -
 198
198 -
 199
199 -
 200
200 -
201
-
202
-
203
-
204
-
205
-
206
-
207
-
208
 |
 |
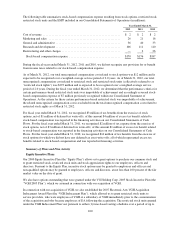
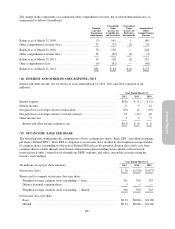
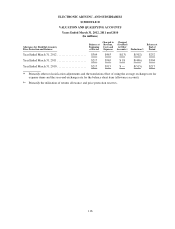
As a result of our net loss for the fiscal years ended March 31, 2011 and 2010, we have excluded all share-based
payment awards from the diluted loss per share calculation as their inclusion would have had an antidilutive
effect. Had we reported net income for these periods, an additional 4 million shares and 2 million shares of
common stock, respectively, would have been included in the number of shares used to calculate Diluted EPS.
For the fiscal years ended March 31, 2012, 2011 and 2010, options to purchase, restricted stock units and
restricted stock to be released in the amount of 10 million shares, 17 million shares and 32 million shares of
common stock, respectively, were excluded from the treasury stock method computation of diluted shares as
their inclusion would have had an antidilutive effect.
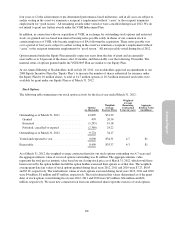
Potentially dilutive shares of common stock related to our 0.75% Convertible Senior Notes due 2016 issued
during the year ended March 31, 2012, which have a conversion price of $31.74 per share and the associated
Warrants, which have a conversion price of $41.14 per share, were excluded from the computation of Diluted
EPS for the year ended March 31, 2012 as their inclusion would have had an antidilutive effect resulting from the
conversion price. The associated Convertible Note Hedge was excluded from the calculation of diluted shares as
the impact is always considered antidilutive since the call option would be exercised by us when the exercise
price is lower than the market price. See Note 11 for additional information related to our 0.75% Convertible
Senior Notes due 2016 and related Convertible Note Hedge and Warrants.
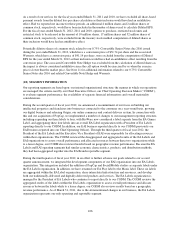
(18) SEGMENT INFORMATION
Our reporting segments are based upon: our internal organizational structure; the manner in which our operations
are managed; the criteria used by our Chief Executive Officer, our Chief Operating Decision Maker (“CODM”),
to evaluate segment performance; the availability of separate financial information; and overall materiality
considerations.
During the second quarter of fiscal year 2012, we announced a recommitment of our focus on building our
intellectual properties and franchises into businesses connected to the consumer on a year-round basis, growing
our digital business and releasing Origin, our online commerce and content delivery system. In connection with
this and our acquisition of PopCap, we implemented a number of changes to our management reporting structure,
including expanding our three labels to four, with BioWare now considered a label separate from the EA Games
Label, and aggregating these four labels into an overall EA Label organization with a President of EA Labels
reporting directly to our CODM. In addition, our EAI business reported directly to our CODM (previously our
EAI business reported into our Chief Operating Officer). Through the third quarter of fiscal year 2012, the
President of the EA Labels and the Executive Vice President of EAI were responsible for allocating resources
within their organizations. The CODM reviewed the disaggregated and aggregated results of the EA Labels and
EAI organizations to assess overall performance and allocated resources between these two organizations while
to a lesser degree, our CODM also reviewed results based on geographic revenue performance. Because the EA
Labels and EAI operating segments had similar economic characteristics, products, and distribution methods,
they had been aggregated together into the EA Brands reportable segment.
During the fourth quarter of fiscal year 2012, in an effort to further advance our goals related to our second
quarter announcement, we integrated the development components of our EAI organization into our EA Labels
organization. This integration included the addition of PopCap and Social/Mobile studios as separate labels under
the EA Labels organization. In addition, we have renamed our EA Play label to the Maxis label. These six labels
are aggregated within the EA Label organization, share interrelated infrastructure and resources, and develop
both our traditionally-delivered and digitally-delivered products and services. The EA Labels organization is
managed by the President of EA Labels who continues to report directly to our CODM. The CODM reviews the
aggregated results of the labels within the EA Labels organization to assess overall performance and allocate
resources between the labels while to a lesser degree, our CODM also reviews results based on a geographic
revenue performance. As of March 31, 2011, due to the aforementioned changes in our business, the EA Labels
organization represents our only operating and reportable segment.
106