Electronic Arts 2012 Annual Report Download - page 136
Download and view the complete annual report
Please find page 136 of the 2012 Electronic Arts annual report below. You can navigate through the pages in the report by either clicking on the pages listed below, or by using the keyword search tool below to find specific information within the annual report.-
 1
1 -
2
-
3
-
4
-
5
-
6
-
7
-
8
-
9
-
10
-
11
-
12
-
13
-
14
-
15
-
16
-
17
-
18
-
19
-
20
-
21
-
22
-
23
-
24
-
25
-
26
-
27
-
28
-
29
-
30
-
31
-
32
-
33
-
34
-
35
-
36
-
37
-
38
-
39
-
40
-
41
-
42
-
43
-
44
-
45
-
46
-
47
-
48
-
49
-
50
-
51
-
52
-
53
-
54
-
55
-
56
-
57
-
58
-
59
-
60
-
61
-
62
-
63
-
64
-
65
-
66
-
67
-
68
-
69
-
70
-
71
-
72
-
73
-
74
-
75
-
76
-
77
-
78
-
79
-
80
-
81
-
82
-
83
-
84
-
85
-
86
-
87
-
88
-
89
-
90
-
91
-
92
-
93
-
94
-
95
-
96
-
97
-
98
-
99
-
100
-
101
-
102
-
103
-
104
-
105
-
106
-
107
-
108
-
109
-
110
-
111
-
112
-
113
-
114
-
115
-
116
-
117
-
118
-
119
-
120
-
121
-
122
-
123
-
124
-
125
-
 126
126 -
 127
127 -
 128
128 -
 129
129 -
 130
130 -
 131
131 -
 132
132 -
 133
133 -
 134
134 -
 135
135 -
 136
136 -
 137
137 -
 138
138 -
 139
139 -
 140
140 -
 141
141 -
 142
142 -
 143
143 -
 144
144 -
 145
145 -
 146
146 -
147
-
148
-
149
-
150
-
151
-
152
-
153
-
154
-
155
-
156
-
157
-
158
-
159
-
160
-
161
-
162
-
163
-
164
-
165
-
166
-
167
-
168
-
169
-
170
-
171
-
172
-
173
-
174
-
175
-
176
-
177
-
178
-
179
-
180
-
181
-
182
-
183
-
184
-
185
-
186
-
187
-
188
-
189
-
190
-
191
-
192
-
193
-
194
-
195
-
196
-
197
-
198
-
199
-
200
-
201
-
202
-
203
-
204
-
205
-
206
-
207
-
208
 |
 |

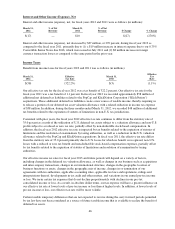
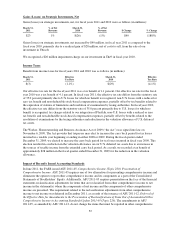
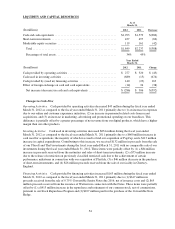
Gains (Losses) on Strategic Investments, Net
Gains (losses) on strategic investments, net, for fiscal years 2011 and 2010 were as follows (in millions):
March 31,
2011
% of Net
Revenue
March 31,
2010
% of Net
Revenue $ Change % Change
$23 1% $(26) (1%) $49 (188%)
Gains (losses) on strategic investments, net increased by $49 million, in fiscal year 2011 as compared to the
fiscal year 2010, primarily due to a realized gain of $28 million, net of costs to sell, from the sale of our
investment in Ubisoft.
We recognized a $26 million impairment charge on our investment in The9 in fiscal year 2010.
Income Taxes
Benefit from income taxes for fiscal years 2011 and 2010 was as follows (in millions):
March 31,
2011
Effective
Tax Rate
March 31,
2010
Effective
Tax Rate
$(3) (1.1%) $(29) (4.1%)
Our effective tax rate for the fiscal year 2011 was a tax benefit of 1.1 percent. Our effective tax rate for the fiscal
year 2010 was a tax benefit of 4.1 percent. In fiscal year 2011, the effective tax rate differs from the statutory rate
of 35.0 percent primarily due to U.S. losses for which no benefit is recognized, non-U.S. losses with a reduced or
zero tax benefit and non-deductible stock-based compensation expenses, partially offset by tax benefits related to
the expiration of statutes of limitations and resolution of examination by taxing authorities. In fiscal year 2010,
the effective tax rate differs from the statutory rate of 35.0 percent primarily due to U.S. losses for which no
benefit is recognized, tax charges related to our integration of Playfish, non-U.S. losses with a reduced or zero
tax benefit, and non-deductible stock-based compensation expenses, partially offset by benefits related to the
resolution of examinations by the taxing authorities and reductions in the valuation allowance of U.S. deferred
tax assets.
The Worker, Homeownership and Business Assistance Act of 2009 (“the Act”) was signed into law on
November 6, 2009. The Act provides that taxpayers may elect to increase the carry back period for tax losses
incurred in a taxable year beginning or ending in either 2008 or 2009. During the fiscal quarter ended
December 31, 2009, we elected to increase the carry back period for tax losses incurred in fiscal year 2009. This
election resulted in a reduction in the valuation allowance on our U.S. deferred tax assets due to an increase in
the sources of taxable income from the extended carry back period. As a result, we recorded a tax benefit of
approximately $28 million in the fiscal quarter ended December 31, 2009 for the reduction in the valuation
allowance.
Impact of Recently Issued Accounting Standards
In June 2011, the FASB issued ASU 2011-05, Comprehensive Income (Topic 220):Presentation of
Comprehensive Income. ASU 2011-05 requires one of two alternatives for presenting comprehensive income and
eliminates the option to report other comprehensive income and its components as a part of the Consolidated
Statements of Stockholders’ Equity. Additionally, ASU 2011-05 requires presentation on the face of the financial
statements reclassification adjustments for items that are reclassified from other comprehensive income to net
income in the statement(s) where the components of net income and the components of other comprehensive
income are presented. The requirement related to the reclassification adjustments from other comprehensive
income to net income was deferred in December 2011, as a result of the issuance of ASU 2011-12, Deferral of
the Effective Date for Amendments to the Presentation of Reclassifications of Items Out of Accumulated Other
Comprehensive Income in Accounting Standards Update 2011-05 (Topic 220). The amendments in ASU
2011-05, as amended by ASU 2011-12, do not change the items that must be reported in other comprehensive
52