Electronic Arts 2012 Annual Report Download - page 128
Download and view the complete annual report
Please find page 128 of the 2012 Electronic Arts annual report below. You can navigate through the pages in the report by either clicking on the pages listed below, or by using the keyword search tool below to find specific information within the annual report.-
 1
1 -
2
-
3
-
4
-
5
-
6
-
7
-
8
-
9
-
10
-
11
-
12
-
13
-
14
-
15
-
16
-
17
-
18
-
19
-
20
-
21
-
22
-
23
-
24
-
25
-
26
-
27
-
28
-
29
-
30
-
31
-
32
-
33
-
34
-
35
-
36
-
37
-
38
-
39
-
40
-
41
-
42
-
43
-
44
-
45
-
46
-
47
-
48
-
49
-
50
-
51
-
52
-
53
-
54
-
55
-
56
-
57
-
58
-
59
-
60
-
61
-
62
-
63
-
64
-
65
-
66
-
67
-
68
-
69
-
70
-
71
-
72
-
73
-
74
-
75
-
76
-
77
-
78
-
79
-
80
-
81
-
82
-
83
-
84
-
85
-
86
-
87
-
88
-
89
-
90
-
91
-
92
-
93
-
94
-
95
-
96
-
97
-
98
-
99
-
100
-
101
-
102
-
103
-
104
-
105
-
106
-
107
-
108
-
109
-
110
-
111
-
112
-
113
-
114
-
115
-
116
-
117
-
 118
118 -
 119
119 -
 120
120 -
 121
121 -
 122
122 -
 123
123 -
 124
124 -
 125
125 -
 126
126 -
 127
127 -
 128
128 -
 129
129 -
 130
130 -
 131
131 -
 132
132 -
 133
133 -
 134
134 -
 135
135 -
 136
136 -
 137
137 -
 138
138 -
139
-
140
-
141
-
142
-
143
-
144
-
145
-
146
-
147
-
148
-
149
-
150
-
151
-
152
-
153
-
154
-
155
-
156
-
157
-
158
-
159
-
160
-
161
-
162
-
163
-
164
-
165
-
166
-
167
-
168
-
169
-
170
-
171
-
172
-
173
-
174
-
175
-
176
-
177
-
178
-
179
-
180
-
181
-
182
-
183
-
184
-
185
-
186
-
187
-
188
-
189
-
190
-
191
-
192
-
193
-
194
-
195
-
196
-
197
-
198
-
199
-
200
-
201
-
202
-
203
-
204
-
205
-
206
-
207
-
208
 |
 |

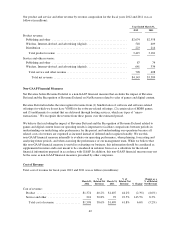
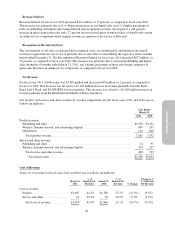
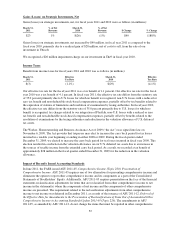
Research and development expenses increase by $59 million, or 5 percent, in fiscal year 2012, as compared to
fiscal year 2011. This increase was primarily due to (1) a $68 million increase in personnel-related costs and (2) a
$13 million increase in facilities-related expenses both primarily resulting from an increase in headcount in
connection with recent acquisitions. These increases were partially offset by a $23 million decrease in
development costs primarily due to a decrease in titles under development.
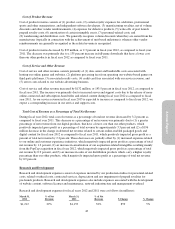
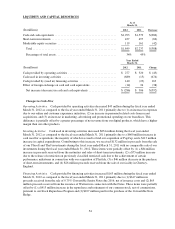
Marketing and Sales
Marketing and sales expenses consist of personnel-related costs, related overhead costs and advertising,
marketing and promotional expenses, net of qualified advertising cost reimbursements from third parties.
Marketing and sales expenses for fiscal years 2012 and 2011 were as follows (in millions):
March 31,
2012
% of Net
Revenue
March 31,
2011
% of Net
Revenue $ Change % Change
$853 21% $747 21% $106 14%
Marketing and sales expenses increased by $106 million, or 14 percent, in fiscal year 2012, as compared to fiscal
year 2011. The increase was primarily due to (1) a $50 million increase in additional personnel-related costs
resulting from an increase in headcount in connection with recent acquisitions, (2) a $29 million increase in
marketing, advertising and promotional spending, and (3) a $18 million increase in contracted service costs
related to online and customer relationship initiatives.
Marketing and sales expenses included vendor reimbursements for advertising expenses of $39 million and $31
million in fiscal years 2012 and 2011, respectively.
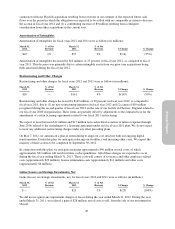
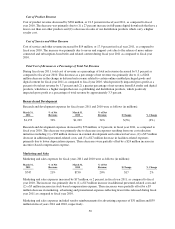
General and Administrative
General and administrative expenses consist of personnel and related expenses of executive and administrative
staff, related overhead costs, fees for professional services such as legal and accounting, and allowances for
doubtful accounts.
General and administrative expenses for fiscal years 2012 and 2011 were as follows (in millions):
March 31,
2012
% of Net
Revenue
March 31,
2011
% of Net
Revenue $ Change % Change
$375 9% $301 8% $74 25%
General and administrative expenses increased by $74 million, or 25 percent, in fiscal year 2012, as compared to
fiscal year 2011. The increase was primarily due to (1) a $34 million increase in contracted service costs related
to online initiatives, litigation, and recent acquisitions, (2) a $27 million accrual related to a potential settlement
of an on-going litigation matter, (3) a $13 million increase in bad debt expense, and (4) a $13 million increase in
additional personnel-related costs resulting from an increase in headcount in connection with recent acquisitions.
These increases were partially offset by a $15 million decrease in facility overhead costs.
Acquisition-Related Contingent Consideration
Acquisition-related contingent consideration for fiscal years 2012 and 2011 were as follows (in millions):
March 31,
2012
% of Net
Revenue
March 31,
2011
% of Net
Revenue $ Change % Change
$11 — $(17) — $28 (165%)
Acquisition-related contingent consideration expense increased by $28 million, or 165 percent, in fiscal year
2012, as compared to fiscal year 2011, primarily related to (1) a $19 million prior year decrease of our accrual in
44