Electronic Arts 2012 Annual Report Download - page 187
Download and view the complete annual report
Please find page 187 of the 2012 Electronic Arts annual report below. You can navigate through the pages in the report by either clicking on the pages listed below, or by using the keyword search tool below to find specific information within the annual report.-
 1
1 -
2
-
3
-
4
-
5
-
6
-
7
-
8
-
9
-
10
-
11
-
12
-
13
-
14
-
15
-
16
-
17
-
18
-
19
-
20
-
21
-
22
-
23
-
24
-
25
-
26
-
27
-
28
-
29
-
30
-
31
-
32
-
33
-
34
-
35
-
36
-
37
-
38
-
39
-
40
-
41
-
42
-
43
-
44
-
45
-
46
-
47
-
48
-
49
-
50
-
51
-
52
-
53
-
54
-
55
-
56
-
57
-
58
-
59
-
60
-
61
-
62
-
63
-
64
-
65
-
66
-
67
-
68
-
69
-
70
-
71
-
72
-
73
-
74
-
75
-
76
-
77
-
78
-
79
-
80
-
81
-
82
-
83
-
84
-
85
-
86
-
87
-
88
-
89
-
90
-
91
-
92
-
93
-
94
-
95
-
96
-
97
-
98
-
99
-
100
-
101
-
102
-
103
-
104
-
105
-
106
-
107
-
108
-
109
-
110
-
111
-
112
-
113
-
114
-
115
-
116
-
117
-
118
-
119
-
120
-
121
-
122
-
123
-
124
-
125
-
126
-
127
-
128
-
129
-
130
-
131
-
132
-
133
-
134
-
135
-
136
-
137
-
138
-
139
-
140
-
141
-
142
-
143
-
144
-
145
-
146
-
147
-
148
-
149
-
150
-
151
-
152
-
153
-
154
-
155
-
156
-
157
-
158
-
159
-
160
-
161
-
162
-
163
-
164
-
165
-
166
-
167
-
168
-
169
-
170
-
171
-
172
-
173
-
174
-
175
-
176
-
 177
177 -
 178
178 -
 179
179 -
 180
180 -
 181
181 -
 182
182 -
 183
183 -
 184
184 -
 185
185 -
 186
186 -
 187
187 -
 188
188 -
 189
189 -
 190
190 -
 191
191 -
 192
192 -
 193
193 -
 194
194 -
 195
195 -
 196
196 -
 197
197 -
198
-
199
-
200
-
201
-
202
-
203
-
204
-
205
-
206
-
207
-
208
 |
 |

Annual Report
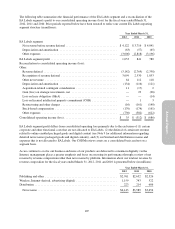
The weighted-average grant date fair value of restricted stock rights is based on the quoted market price of our
common stock on the date of grant. The weighted-average grant date fair values of restricted stock rights granted
during fiscal years 2012, 2011 and 2010 were $21.38, $17.38 and $18.10, respectively. The total grant date fair
values of restricted stock rights that vested during fiscal years 2012, 2011 and 2010 were $165 million, $142
million and $129 million, respectively.
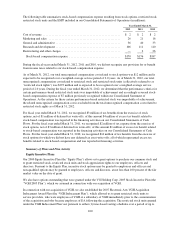
Performance-Based Restricted Stock Units
Our performance-based restricted stock units vest contingent upon the achievement of pre-determined
performance-based milestones. If these performance-based milestones are not met, the restricted stock units will
not vest, in which case, any compensation expense we have recognized to date will be reversed.
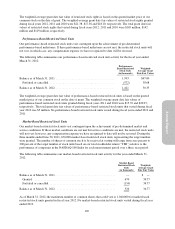
The following table summarizes our performance-based restricted stock unit activity for the fiscal year ended
March 31, 2012:
Performance-
Based Restricted
Stock Units
(in thousands)
Weighted-
Average Grant
Date Fair Values
Balance as of March 31, 2011 ........................................ 1,993 $47.00
Forfeited or cancelled ............................................ (572) 38.68
Balance as of March 31, 2012 ........................................ 1,421 50.35
The weighted-average grant date fair value of performance-based restricted stock units is based on the quoted
market price of our common stock on the date of grant. The weighted-average grant date fair values of
performance-based restricted stock units granted during fiscal years 2011 and 2010 were $15.39 and $20.93,
respectively. The total grant date fair values of performance-based restricted stock units that vested during fiscal
year 2010 was $5 million. No performance-based restricted stock units vested during fiscal years ended 2012 and
2011.
Market-Based Restricted Stock Units
Our market-based restricted stock units vest contingent upon the achievement of pre-determined market and
service conditions. If these market conditions are not met but service conditions are met, the restricted stock units
will not vest; however, any compensation expense we have recognized to date will not be reversed. During the
three months ended June 30, 2011, 670,000 market-based restricted stock units, representing the target number,
were granted. The number of shares of common stock to be received at vesting will range from zero percent to
200 percent of the target number of stock units based on our total stockholder return (“TSR”) relative to the
performance of companies in the NASDAQ-100 Index for each measurement period over a three year period.
The following table summarizes our market-based restricted stock unit activity for the year ended March 31,
2012:
Market-Based
Restricted Stock
Units
(in thousands)
Weighted-
Average Grant
Date Fair Value
Balance as of March 31, 2011 ......................................... — $ —
Granted ........................................................ 670 34.77
Forfeited or cancelled ............................................. (150) 34.77
Balance as of March 31, 2012 ......................................... 520 34.77
As of March 31, 2012, the maximum number of common shares that could vest is 1,040,000 for market-based
restricted stock units granted in fiscal year 2012. No market-based restricted stock units vested during fiscal year
ended 2012.
103