Electronic Arts 2012 Annual Report Download - page 158
Download and view the complete annual report
Please find page 158 of the 2012 Electronic Arts annual report below. You can navigate through the pages in the report by either clicking on the pages listed below, or by using the keyword search tool below to find specific information within the annual report.-
 1
1 -
2
-
3
-
4
-
5
-
6
-
7
-
8
-
9
-
10
-
11
-
12
-
13
-
14
-
15
-
16
-
17
-
18
-
19
-
20
-
21
-
22
-
23
-
24
-
25
-
26
-
27
-
28
-
29
-
30
-
31
-
32
-
33
-
34
-
35
-
36
-
37
-
38
-
39
-
40
-
41
-
42
-
43
-
44
-
45
-
46
-
47
-
48
-
49
-
50
-
51
-
52
-
53
-
54
-
55
-
56
-
57
-
58
-
59
-
60
-
61
-
62
-
63
-
64
-
65
-
66
-
67
-
68
-
69
-
70
-
71
-
72
-
73
-
74
-
75
-
76
-
77
-
78
-
79
-
80
-
81
-
82
-
83
-
84
-
85
-
86
-
87
-
88
-
89
-
90
-
91
-
92
-
93
-
94
-
95
-
96
-
97
-
98
-
99
-
100
-
101
-
102
-
103
-
104
-
105
-
106
-
107
-
108
-
109
-
110
-
111
-
112
-
113
-
114
-
115
-
116
-
117
-
118
-
119
-
120
-
121
-
122
-
123
-
124
-
125
-
126
-
127
-
128
-
129
-
130
-
131
-
132
-
133
-
134
-
135
-
136
-
137
-
138
-
139
-
140
-
141
-
142
-
143
-
144
-
145
-
146
-
147
-
 148
148 -
 149
149 -
 150
150 -
 151
151 -
 152
152 -
 153
153 -
 154
154 -
 155
155 -
 156
156 -
 157
157 -
 158
158 -
 159
159 -
 160
160 -
 161
161 -
 162
162 -
 163
163 -
 164
164 -
 165
165 -
 166
166 -
 167
167 -
 168
168 -
169
-
170
-
171
-
172
-
173
-
174
-
175
-
176
-
177
-
178
-
179
-
180
-
181
-
182
-
183
-
184
-
185
-
186
-
187
-
188
-
189
-
190
-
191
-
192
-
193
-
194
-
195
-
196
-
197
-
198
-
199
-
200
-
201
-
202
-
203
-
204
-
205
-
206
-
207
-
208
 |
 |
March 31, 2012, 2011 and 2010, advertising expense, net of vendor reimbursements, totaled approximately $321
million, $312 million, and $326 million, respectively.
Software Development Costs
Research and development costs, which consist primarily of software development costs, are expensed as
incurred. We are required to capitalize software development costs incurred for computer software to be sold,
leased or otherwise marketed after technological feasibility of the software is established or for development
costs that have alternative future uses. Under our current practice of developing new products, the technological
feasibility of the underlying software is not established until substantially all product development and testing is
complete, which generally includes the development of a working model. The software development costs that
have been capitalized to date have been insignificant.
Stock-Based Compensation
We are required to estimate the fair value of share-based payment awards on the date of grant. We recognize
compensation costs for stock-based payment awards to employees based on the grant-date fair value using a
straight-line approach over the service period for which such awards are expected to vest.
We determine the fair value of our share-based payment awards as follows:
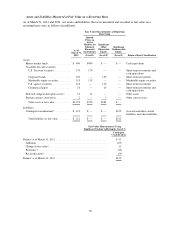
•Restricted Stock Units, Restricted Stock, and Performance-Based Restricted Stock Units. The fair value of
restricted stock units, restricted stock, and performance-based restricted stock units (other than market-based
restricted stock units) is determined based on the quoted market price of our common stock on the date of
grant. Performance-based restricted stock units include grants made (1) to certain members of executive
management primarily granted in fiscal year 2008 and (2) in connection with certain acquisitions.
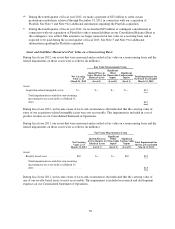
•Market-Based Restricted Stock Units. Market-based restricted stock units consist of grants of
performance-based restricted stock units to certain members of executive management (referred to herein
as “market-based restricted stock units”). The fair value of our market-based restricted stock units is
determined using a Monte-Carlo simulation model. Key assumptions for the Monte-Carlo simulation
model are the risk-free interest rate, expected volatility, expected dividends and correlation coefficient.
•Stock Options and Employee Stock Purchase Plan. The fair value of stock options and stock purchase
rights granted pursuant to our equity incentive plans and our 2000 Employee Stock Purchase Plan
(“ESPP”), respectively, is determined using the Black-Scholes valuation model based on the multiple-
award valuation method. Key assumptions of the Black-Scholes valuation model are the risk-free interest
rate, expected volatility, expected term and expected dividends.
The determination of the fair value of market-based restricted stock units, stock options and ESPP is affected by
assumptions regarding subjective and complex variables. Generally, our assumptions are based on historical
information and judgment is required to determine if historical trends may be indicators of future outcomes.
Employee stock-based compensation expense is calculated based on awards ultimately expected to vest and is
reduced for estimated forfeitures. Forfeitures are revised, if necessary, in subsequent periods if actual forfeitures
differ from those estimates and an adjustment to stock-based compensation expense will be recognized at that time.
Foreign Currency Translation
For each of our foreign operating subsidiaries, the functional currency is generally its local currency. Assets and
liabilities of foreign operations are translated into U.S. dollars using month-end exchange rates, and revenue and
expenses are translated into U.S. dollars using average exchange rates. The effects of foreign currency translation
adjustments are included as a component of accumulated other comprehensive income in stockholders’ equity.
Foreign currency transaction gains and losses are a result of the effect of exchange rate changes on transactions
denominated in currencies other than the functional currency. Net foreign currency transaction gains (losses) of
$(29) million, $12 million, and $(19) million for the fiscal years ended March 31, 2012, 2011 and 2010,
respectively, are included in interest and other income, net, in our Consolidated Statements of Operations.
74