Electronic Arts 2012 Annual Report Download - page 132
Download and view the complete annual report
Please find page 132 of the 2012 Electronic Arts annual report below. You can navigate through the pages in the report by either clicking on the pages listed below, or by using the keyword search tool below to find specific information within the annual report.-
 1
1 -
2
-
3
-
4
-
5
-
6
-
7
-
8
-
9
-
10
-
11
-
12
-
13
-
14
-
15
-
16
-
17
-
18
-
19
-
20
-
21
-
22
-
23
-
24
-
25
-
26
-
27
-
28
-
29
-
30
-
31
-
32
-
33
-
34
-
35
-
36
-
37
-
38
-
39
-
40
-
41
-
42
-
43
-
44
-
45
-
46
-
47
-
48
-
49
-
50
-
51
-
52
-
53
-
54
-
55
-
56
-
57
-
58
-
59
-
60
-
61
-
62
-
63
-
64
-
65
-
66
-
67
-
68
-
69
-
70
-
71
-
72
-
73
-
74
-
75
-
76
-
77
-
78
-
79
-
80
-
81
-
82
-
83
-
84
-
85
-
86
-
87
-
88
-
89
-
90
-
91
-
92
-
93
-
94
-
95
-
96
-
97
-
98
-
99
-
100
-
101
-
102
-
103
-
104
-
105
-
106
-
107
-
108
-
109
-
110
-
111
-
112
-
113
-
114
-
115
-
116
-
117
-
118
-
119
-
120
-
121
-
 122
122 -
 123
123 -
 124
124 -
 125
125 -
 126
126 -
 127
127 -
 128
128 -
 129
129 -
 130
130 -
 131
131 -
 132
132 -
 133
133 -
 134
134 -
 135
135 -
 136
136 -
 137
137 -
 138
138 -
 139
139 -
 140
140 -
 141
141 -
 142
142 -
143
-
144
-
145
-
146
-
147
-
148
-
149
-
150
-
151
-
152
-
153
-
154
-
155
-
156
-
157
-
158
-
159
-
160
-
161
-
162
-
163
-
164
-
165
-
166
-
167
-
168
-
169
-
170
-
171
-
172
-
173
-
174
-
175
-
176
-
177
-
178
-
179
-
180
-
181
-
182
-
183
-
184
-
185
-
186
-
187
-
188
-
189
-
190
-
191
-
192
-
193
-
194
-
195
-
196
-
197
-
198
-
199
-
200
-
201
-
202
-
203
-
204
-
205
-
206
-
207
-
208
 |
 |

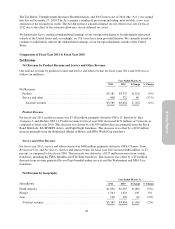
Net revenue in North America was $1,836 million, or 51% of total net revenue for fiscal year 2011, compared to
$2,025 million, or 55% of total net revenue for fiscal year 2010, a decrease of $189 million, or 9%. Net revenue
in Europe and Asia was $1,753 million, or 49 percent of total net revenue for fiscal year 2011, compared to
$1,629 million, or 45 percent of total net revenue for fiscal year 2010, an increase of $124 million, or 8 percent.
The increase in revenue outside of North America was the primarily the result of increased revenue from the
Battlefield, Medal of Honor, and FIFA World Cup franchises in Europe. Additionally, the value of the U.S.
dollar relative to foreign currencies contributed to a net decrease of total reported net revenue of approximately
$71 million (primarily the Euro), or 4 percent of total net revenue.
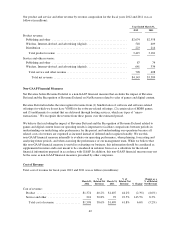
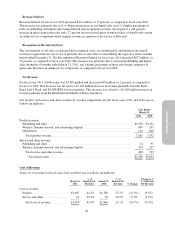
Supplemental Net Revenue by Revenue Composition
Our total net revenue by revenue composition for the fiscal years 2011 and 2010 was as follows (in millions):
Year Ended March 31,
2011 2010 $ Change % Change
Publishing and other ........................................ $2,781 $ 2,983 $(202) (7%)
Wireless, Internet-derived, and advertising (digital) ............... 833 570 263 46%
Distribution ............................................... 214 606 (392) (65%)
Net Revenue before Revenue Deferral ........................ 3,828 4,159 (331) (8%)
Revenue Deferral .......................................... (2,769) (2,358) (411) 17%
Recognition of Revenue Deferral .............................. 2,530 1,853 677 37%
Net Revenue ............................................ $3,589 $ 3,654 $ (65) (2%)
Net Revenue before Revenue Deferral
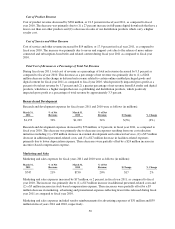
Publishing and Other Revenue
For fiscal year 2011, publishing and other Net Revenue before Revenue Deferral was $2,781 million, primarily
driven by FIFA 11, Madden 11, and Need for Speed Hot Pursuit. Publishing and other Net Revenue before
Revenue Deferral for fiscal year 2011 decreased $202 million, or 7 percent, as compared to fiscal year 2010. This
decrease was driven by a $943 million decrease in sales primarily from the Battlefield, Army of Two, Mass
Effect, EA SPORTS Active, NBA Live, and Godfather franchises, as well as Dante’s Inferno. This decrease was
offset by a $741 million increase in sales primarily from the Medal of Honor, FIFA World Cup, and Crysis
franchises.
Wireless, Internet-derived, and Advertising (Digital) Revenue
For fiscal year 2011, digital Net Revenue before Deferral was $833 million, an increase of $263 million, or 46
percent, as compared to fiscal year 2010. This increase was driven by a $318 million increase in sales primarily
from the FIFA, Battlefield, Madden, The Sims, Mass Effect, Need for Speed, Medal of Honor, Dragon Age, and
Dead Space franchises, as well as Scrabble. This increase was offset by a $55 million decrease in sales primarily
from the Warhammer and Tetris franchises, as well as a decrease in sales generated from our Pogo-branded
online services.
Distribution Revenue
For fiscal year 2011, distribution Net Revenue was $214 million and decreased $392 million, or 65 percent, as
compared to fiscal year 2010 driven by a $403 million decrease in sales primarily in the Rock Band and Portal
franchises. This decrease was partially offset by an $11 million increase in sales primarily from Rango.
48