Electronic Arts 2012 Annual Report Download - page 175
Download and view the complete annual report
Please find page 175 of the 2012 Electronic Arts annual report below. You can navigate through the pages in the report by either clicking on the pages listed below, or by using the keyword search tool below to find specific information within the annual report.-
 1
1 -
2
-
3
-
4
-
5
-
6
-
7
-
8
-
9
-
10
-
11
-
12
-
13
-
14
-
15
-
16
-
17
-
18
-
19
-
20
-
21
-
22
-
23
-
24
-
25
-
26
-
27
-
28
-
29
-
30
-
31
-
32
-
33
-
34
-
35
-
36
-
37
-
38
-
39
-
40
-
41
-
42
-
43
-
44
-
45
-
46
-
47
-
48
-
49
-
50
-
51
-
52
-
53
-
54
-
55
-
56
-
57
-
58
-
59
-
60
-
61
-
62
-
63
-
64
-
65
-
66
-
67
-
68
-
69
-
70
-
71
-
72
-
73
-
74
-
75
-
76
-
77
-
78
-
79
-
80
-
81
-
82
-
83
-
84
-
85
-
86
-
87
-
88
-
89
-
90
-
91
-
92
-
93
-
94
-
95
-
96
-
97
-
98
-
99
-
100
-
101
-
102
-
103
-
104
-
105
-
106
-
107
-
108
-
109
-
110
-
111
-
112
-
113
-
114
-
115
-
116
-
117
-
118
-
119
-
120
-
121
-
122
-
123
-
124
-
125
-
126
-
127
-
128
-
129
-
130
-
131
-
132
-
133
-
134
-
135
-
136
-
137
-
138
-
139
-
140
-
141
-
142
-
143
-
144
-
145
-
146
-
147
-
148
-
149
-
150
-
151
-
152
-
153
-
154
-
155
-
156
-
157
-
158
-
159
-
160
-
161
-
162
-
163
-
164
-
 165
165 -
 166
166 -
 167
167 -
 168
168 -
 169
169 -
 170
170 -
 171
171 -
 172
172 -
 173
173 -
 174
174 -
 175
175 -
 176
176 -
 177
177 -
 178
178 -
 179
179 -
 180
180 -
 181
181 -
 182
182 -
 183
183 -
 184
184 -
 185
185 -
186
-
187
-
188
-
189
-
190
-
191
-
192
-
193
-
194
-
195
-
196
-
197
-
198
-
199
-
200
-
201
-
202
-
203
-
204
-
205
-
206
-
207
-
208
 |
 |

Annual Report
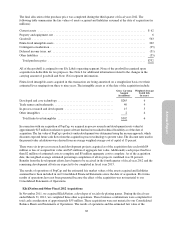
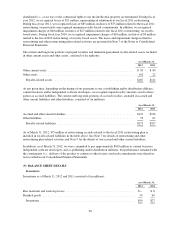
Property and Equipment, Net
Property and equipment, net, as of March 31, 2012 and 2011 consisted of (in millions):
As of March 31,
2012 2011
Computer equipment and software .............................................. $ 575 $ 504
Buildings .................................................................. 339 355
Leasehold improvements ...................................................... 121 105
Office equipment, furniture and fixtures .......................................... 72 67
Land ...................................................................... 64 66
Warehouse equipment and other ................................................ 10 10
Construction in progress ...................................................... 38 20
1,219 1,127
Less accumulated depreciation ................................................. (651) (614)
Property and equipment, net ................................................. $ 568 $ 513
Depreciation expense associated with property and equipment was $102 million, $104 million and $123 million
for the fiscal years ended March 31, 2012, 2011 and 2010, respectively.
On July 13, 2009, we purchased our Redwood Shores headquarters facilities comprised of approximately
660,000 square feet concurrent with the expiration and extinguishment of the lessor’s financing agreements.
These facilities were subject to lease obligations, which expired in July 2009, and had previously been accounted
for as operating leases. The total amount paid under the terms of the leases was $247 million, of which $233
million related to the purchase price of the facilities and $14 million was for the loss on our lease obligation. This
$14 million loss is included in general and administrative expense in our Consolidated Statements of Operations
for the fiscal year ended March 31, 2010. Subsequent to our purchase, we classified the facilities on our
Consolidated Balance Sheet as property and equipment, net, and depreciate the facilities acquired, excluding
land, on a straight-line basis over the estimated useful lives.
Acquisition-Related Restricted Cash Included in Other Current Assets
Included in other current assets on our Consolidated Balance Sheets as of March 31, 2012 and 2011 was $31 million
and $100 million, respectively, of acquisition-related restricted cash. In connection with our acquisition of Playfish in
fiscal year 2010, we deposited $100 million into an escrow account to pay the former shareholders of Playfish in the
event certain performance milestones were achieved through December 31, 2011. As a result of certain milestone
achievements through December 31, 2011, we paid $25 million in the fourth quarter of fiscal 2012 and expect to pay
an additional $25 million in the second quarter of fiscal 2013. We have reclassified the remaining $50 million to cash
and cash equivalents. In connection with our acquisition of PopCap in August 2011, we acquired $6 million of
additional restricted cash held in an escrow account in the event certain liabilities become due. As these deposits are
restricted in nature, they are excluded from cash and cash equivalents.
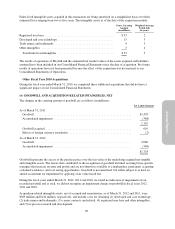
Accrued and Other Current Liabilities
Accrued and other current liabilities as of March 31, 2012 and 2011 consisted of (in millions):
As of March 31,
2012 2011
Other accrued expenses ....................................................... $441 $359
Accrued compensation and benefits ............................................. 233 232
Accrued royalties ............................................................ 98 96
Deferred net revenue (other) ................................................... 85 81
Accrued and other current liabilities ........................................... $857 $768
91