General Motors 2011 Annual Report Download - page 10
Download and view the complete annual report
Please find page 10 of the 2011 General Motors annual report below. You can navigate through the pages in the report by either clicking on the pages listed below, or by using the keyword search tool below to find specific information within the annual report.-
 1
1 -
 2
2 -
 3
3 -
 4
4 -
 5
5 -
 6
6 -
 7
7 -
 8
8 -
 9
9 -
 10
10 -
 11
11 -
 12
12 -
 13
13 -
 14
14 -
 15
15 -
 16
16 -
 17
17 -
 18
18 -
 19
19 -
 20
20 -
 21
21 -
22
-
23
-
24
-
25
-
26
-
27
-
28
-
29
-
30
-
31
-
32
-
33
-
34
-
35
-
36
-
37
-
38
-
39
-
40
-
41
-
42
-
43
-
44
-
45
-
46
-
47
-
48
-
49
-
50
-
51
-
52
-
53
-
54
-
55
-
56
-
57
-
58
-
59
-
60
-
61
-
62
-
63
-
64
-
65
-
66
-
67
-
68
-
69
-
70
-
71
-
72
-
73
-
74
-
75
-
76
-
77
-
78
-
79
-
80
-
81
-
82
-
83
-
84
-
85
-
86
-
87
-
88
-
89
-
90
-
91
-
92
-
93
-
94
-
95
-
96
-
97
-
98
-
99
-
100
-
101
-
102
-
103
-
104
-
105
-
106
-
107
-
108
-
109
-
110
-
111
-
112
-
113
-
114
-
115
-
116
-
117
-
118
-
119
-
120
-
121
-
122
-
123
-
124
-
125
-
126
-
127
-
128
-
129
-
130
-
131
-
132
-
133
-
134
-
135
-
136
-
137
-
138
-
139
-
140
-
141
-
142
-
143
-
144
-
145
-
146
-
147
-
148
-
149
-
150
-
151
-
152
-
153
-
154
-
155
-
156
-
157
-
158
-
159
-
160
-
161
-
162
-
163
-
164
-
165
-
166
-
167
-
168
-
169
-
170
-
171
-
172
-
173
-
174
-
175
-
176
-
177
-
178
-
179
-
180
-
181
-
182
-
183
-
184
-
185
-
186
-
187
-
188
-
189
-
190
-
191
-
192
-
193
-
194
-
195
-
196
-
197
-
198
-
199
-
200
 |
 |

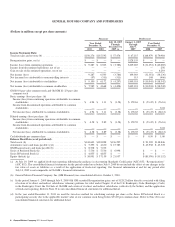
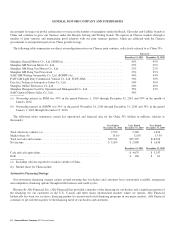
GENERAL MOTORS COMPANY AND SUBSIDIARIES
(Dollars in millions except per share amounts)
Successor Predecessor
Year Ended
December 31,
July 10, 2009
Through
December 31,
2009 (a)
January 1, 2009
Through
July 9,
2009
Year Ended
December 31,
2011 2010 2008 2007
Income Statement Data:
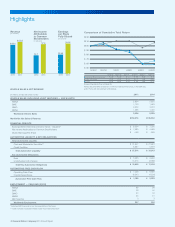
Total net sales and revenue (b) ............................... $150,276 $135,592 $ 57,474 $ 47,115 $148,979 $179,984
Reorganization gains, net (c) ................................ $ — $ — $ — $128,155 $ — $ —
Income (loss) from continuing operations ...................... $ 9,287 $ 6,503 $ (3,786) $109,003 $ (31,051) $ (42,685)
Income from discontinued operations, net of tax . . . . . . . . . . . . . . . . . — — — — — 256
Gain on sale of discontinued operations, net of tax ............... — — — — — 4,293
Net income (loss) ......................................... 9,287 6,503 (3,786) 109,003 (31,051) (38,136)
Net (income) loss attributable to noncontrolling interests .......... (97) (331) (511) 115 108 (406)
Net income (loss) attributable to stockholders ................... $ 9,190 $ 6,172 $ (4,297) $109,118 $ (30,943) $ (38,542)
Net income (loss) attributable to common stockholders ........... $ 7,585 $ 4,668 $ (4,428) $109,118 $ (30,943) $ (38,542)
GM $0.01 par value common stock and Old GM $1-2/3 par value
common stock
Basic earnings (loss) per share: (d)
Income (loss) from continuing operations attributable to common
stockholders ......................................... $ 4.94 $ 3.11 $ (3.58) $ 178.63 $ (53.47) $ (76.16)
Income from discontinued operations attributable to common
stockholders ......................................... — — — — — 8.04
Net income (loss) attributable to common stockholders ......... $ 4.94 $ 3.11 $ (3.58) $ 178.63 $ (53.47) $ (68.12)
Diluted earnings (loss) per share: (d)
Income (loss) from continuing operations attributable to common
stockholders ......................................... $ 4.58 $ 2.89 $ (3.58) $ 178.55 $ (53.47) $ (76.16)
Income from discontinued operations attributable to common
stockholders ......................................... — — — — — 8.04
Net income (loss) attributable to common stockholders ......... $ 4.58 $ 2.89 $ (3.58) $ 178.55 $ (53.47) $ (68.12)
Cash dividends per common share ............................ $ — $ — $ — $ — $ 0.50 $ 1.00
Balance Sheet Data (as of period end):
Total assets (b) ........................................... $144,603 $138,898 $136,295 $ 91,039 $148,846
Automotive notes and loans payable (e)(f) ...................... $ 5,295 $ 4,630 $ 15,783 $ 45,938 $ 43,578
GM Financial notes and loans payable (b) ...................... $ 8,538 $ 7,032
Series A Preferred Stock (h) ................................. $ 5,536 $ 5,536 $ 6,998 $ — $ —
Series B Preferred Stock (i) ................................. $ 4,855 $ 4,855 $ — $ — $ —
Equity (deficit) (g) ........................................ $ 38,991 $ 37,159 $ 21,957 $ (85,076) $ (35,152)
(a) At July 10, 2009 we applied fresh-start reporting following the guidance in Accounting Standards Codification (ASC) 852, “Reorganizations”
(ASC 852). The consolidated financial statements for the periods ended on or before July 9, 2009 do not include the effect of any changes in the
fair value of assets or liabilities as a result of the application of fresh-start reporting. Our financial information at and for any period after
July 10, 2009 is not comparable to Old GM’s financial information.
(b) General Motors Financial Company, Inc. (GM Financial) was consolidated effective October 1, 2010.
(c) In the period January 1, 2009 through July 9, 2009 Old GM recorded Reorganization gains, net of $128.2 billion directly associated with filing
of certain of its direct and indirect subsidiaries voluntary petitions for relief under Chapter 11 of the U.S. Bankruptcy Code (Bankruptcy Code)
in the Bankruptcy Court, the 363 Sale of Old GM and certain of its direct and indirect subsidiaries (collectively the Sellers) and the application
of fresh-start reporting. Refer to Note 32 to our consolidated financial statements for additional detail.
(d) In the year ended December 31, 2011 we used the two-class method for calculating earnings per share as the Series B Preferred Stock is a
participating security due to the applicable market value of our common stock being below $33.00 per common share. Refer to Note 26 to our
consolidated financial statements for additional detail.
8 General Motors Company 2011 Annual Report