General Motors 2011 Annual Report Download - page 45
Download and view the complete annual report
Please find page 45 of the 2011 General Motors annual report below. You can navigate through the pages in the report by either clicking on the pages listed below, or by using the keyword search tool below to find specific information within the annual report.-
 1
1 -
2
-
3
-
4
-
5
-
6
-
7
-
8
-
9
-
10
-
11
-
12
-
13
-
14
-
15
-
16
-
17
-
18
-
19
-
20
-
21
-
22
-
23
-
24
-
25
-
26
-
27
-
28
-
29
-
30
-
31
-
32
-
33
-
34
-
 35
35 -
 36
36 -
 37
37 -
 38
38 -
 39
39 -
 40
40 -
 41
41 -
 42
42 -
 43
43 -
 44
44 -
 45
45 -
 46
46 -
 47
47 -
 48
48 -
 49
49 -
 50
50 -
 51
51 -
 52
52 -
 53
53 -
 54
54 -
 55
55 -
56
-
57
-
58
-
59
-
60
-
61
-
62
-
63
-
64
-
65
-
66
-
67
-
68
-
69
-
70
-
71
-
72
-
73
-
74
-
75
-
76
-
77
-
78
-
79
-
80
-
81
-
82
-
83
-
84
-
85
-
86
-
87
-
88
-
89
-
90
-
91
-
92
-
93
-
94
-
95
-
96
-
97
-
98
-
99
-
100
-
101
-
102
-
103
-
104
-
105
-
106
-
107
-
108
-
109
-
110
-
111
-
112
-
113
-
114
-
115
-
116
-
117
-
118
-
119
-
120
-
121
-
122
-
123
-
124
-
125
-
126
-
127
-
128
-
129
-
130
-
131
-
132
-
133
-
134
-
135
-
136
-
137
-
138
-
139
-
140
-
141
-
142
-
143
-
144
-
145
-
146
-
147
-
148
-
149
-
150
-
151
-
152
-
153
-
154
-
155
-
156
-
157
-
158
-
159
-
160
-
161
-
162
-
163
-
164
-
165
-
166
-
167
-
168
-
169
-
170
-
171
-
172
-
173
-
174
-
175
-
176
-
177
-
178
-
179
-
180
-
181
-
182
-
183
-
184
-
185
-
186
-
187
-
188
-
189
-
190
-
191
-
192
-
193
-
194
-
195
-
196
-
197
-
198
-
199
-
200
 |
 |

GENERAL MOTORS COMPANY AND SUBSIDIARIES
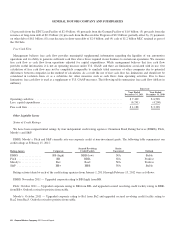
We manage our liquidity primarily at our treasury centers as well as at certain of our significant consolidated overseas subsidiaries.
Our cash equivalents and marketable securities balances include investments in U.S. government and agency obligations, foreign
government securities, time deposits and certificates of deposits and corporate debt securities, and are primarily denominated in U.S.
Dollars. Our investment guidelines, which we may change from time to time, prescribe certain minimum credit rating thresholds and
limit our exposures to any particular sector, asset class, issuance or security type. Substantially all of our current investments in debt
securities are with A/A2 or better rated issuers. We maintain cash balances and investments in certain foreign currencies, such as the
Canadian Dollar, to fund future payments on foreign currency denominated obligations thereby reducing a portion of the related
foreign currency exposure. We actively monitor and manage our liquidity exposure to Europe which is related primarily to short-term
bank deposits and short-term debt securities of high-quality European issuers. A portion of our total liquidity includes amounts
deemed indefinitely reinvested in our foreign subsidiaries. We have used and will continue to use other methods including inter-
company loans to utilize these funds across our global operations as needed. The following table summarizes our liquidity (dollars in
millions):
Successor
December 31, 2011 December 31, 2010
Cash and cash equivalents ......................................................... $15,499 $21,061
Marketable securities ............................................................ 16,148 5,555
Available liquidity ............................................................. 31,647 26,616
Available under credit facilities .................................................... 5,867 5,919
Total available liquidity ........................................................ 37,514 32,535
HCT escrow account (a) .......................................................... — 1,008
Total liquidity including HCT escrow account ......................................... $37,514 $33,543
(a) Classified as Restricted cash and marketable securities.
Upon implementation of the HCT, we used funds in an escrow account to fund a payment to the HCT of $0.8 billion. Following
implementation the remaining funds held in escrow of $0.2 billion were no longer subject to restrictions and were released to us.
Refer to Note 18 to our consolidated financial statements for additional information on the HCT settlement.
GM
Total available liquidity increased by $5.0 billion in the year ended December 31, 2011 due primarily to: (1) positive operating cash
flows of $7.4 billion; (2) proceeds received from the sale of investments in New Delphi and Ally Financial of $4.8 billion; and
(3) decreases to restricted cash balances of $1.4 billion, partially offset by (4) capital expenditures of $6.2 billion; and (5) negative
cash from financing activities of $1.9 billion related primarily to debt prepayments and dividend payments.
Total available liquidity increased by $9.1 billion in the year ended December 31, 2010 due to: (1) positive operating and investing
cash flows of $7.3 billion; (2) increased marketable securities balances of $5.4 billion; and (3) additional amounts available under
credit facilities of $5.3 billion due to a $5.0 billion secured credit facility; partially offset by (4) negative cash flows from financing
activities of $9.3 billion related to prepayments on debt obligations.
UST Credit Agreement and Canadian Loan
UST Credit Agreement
Old GM received total proceeds of $19.8 billion from the UST under the UST Loan Agreement and additional funding of $33.3
billion from the UST and EDC under its DIP Facility. On July 10, 2009 we entered into the UST Credit Agreement and assumed debt
of $7.1 billion which Old GM incurred under its DIP Facility. We repaid the final remaining amounts outstanding on the UST Credit
Agreement in April 2010. Amounts repaid under the agreement may not be reborrowed.
General Motors Company 2011 Annual Report 43