General Motors 2011 Annual Report Download - page 23
Download and view the complete annual report
Please find page 23 of the 2011 General Motors annual report below. You can navigate through the pages in the report by either clicking on the pages listed below, or by using the keyword search tool below to find specific information within the annual report.-
 1
1 -
2
-
3
-
4
-
5
-
6
-
7
-
8
-
9
-
10
-
11
-
12
-
 13
13 -
 14
14 -
 15
15 -
 16
16 -
 17
17 -
 18
18 -
 19
19 -
 20
20 -
 21
21 -
 22
22 -
 23
23 -
 24
24 -
 25
25 -
 26
26 -
 27
27 -
 28
28 -
 29
29 -
 30
30 -
 31
31 -
 32
32 -
 33
33 -
34
-
35
-
36
-
37
-
38
-
39
-
40
-
41
-
42
-
43
-
44
-
45
-
46
-
47
-
48
-
49
-
50
-
51
-
52
-
53
-
54
-
55
-
56
-
57
-
58
-
59
-
60
-
61
-
62
-
63
-
64
-
65
-
66
-
67
-
68
-
69
-
70
-
71
-
72
-
73
-
74
-
75
-
76
-
77
-
78
-
79
-
80
-
81
-
82
-
83
-
84
-
85
-
86
-
87
-
88
-
89
-
90
-
91
-
92
-
93
-
94
-
95
-
96
-
97
-
98
-
99
-
100
-
101
-
102
-
103
-
104
-
105
-
106
-
107
-
108
-
109
-
110
-
111
-
112
-
113
-
114
-
115
-
116
-
117
-
118
-
119
-
120
-
121
-
122
-
123
-
124
-
125
-
126
-
127
-
128
-
129
-
130
-
131
-
132
-
133
-
134
-
135
-
136
-
137
-
138
-
139
-
140
-
141
-
142
-
143
-
144
-
145
-
146
-
147
-
148
-
149
-
150
-
151
-
152
-
153
-
154
-
155
-
156
-
157
-
158
-
159
-
160
-
161
-
162
-
163
-
164
-
165
-
166
-
167
-
168
-
169
-
170
-
171
-
172
-
173
-
174
-
175
-
176
-
177
-
178
-
179
-
180
-
181
-
182
-
183
-
184
-
185
-
186
-
187
-
188
-
189
-
190
-
191
-
192
-
193
-
194
-
195
-
196
-
197
-
198
-
199
-
200
 |
 |

GENERAL MOTORS COMPANY AND SUBSIDIARIES
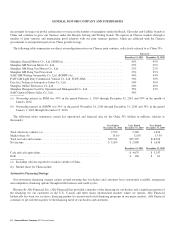
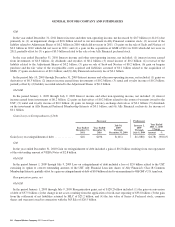
Consolidated Results of Operations
(Dollars in Millions)
Successor Predecessor
Year Ended
December 31, 2011
Year Ended
December 31, 2010
July 10, 2009
Through
December 31, 2009
January 1, 2009
Through
July 9, 2009
Net sales and revenue
Automotive sales and revenue ........................ $148,866 $135,311 $57,474 $ 47,115
GM Financial revenue .............................. 1,410 281 — —
Total net sales and revenue .......................... 150,276 135,592 57,474 47,115
Costs and expenses
Automotive cost of sales .............................. 130,386 118,768 56,316 55,814
GM Financial operating and other expenses . . . . . . . . . . . . . . . 785 152 — —
Automotive selling, general and administrative expense ..... 12,105 11,446 6,006 6,161
Other automotive expenses, net . . . . . . . . . . . . . . . . . . . . . . . . . 58 118 15 1,235
Goodwill impairment charges .......................... 1,286 — — —
Total costs and expenses .............................. 144,620 130,484 62,337 63,210
Operating income (loss) .............................. 5,656 5,108 (4,863) (16,095)
Equity in income of and disposition of interest in Ally
Financial ........................................ — — — 1,380
Automotive interest expense . . . . . . . . . . . . . . . . . . . . . . . . . . . 540 1,098 694 5,428
Interest income and other non-operating income, net . . . . . . . . 851 1,531 375 852
Gain (loss) on extinguishment of debt . . . . . . . . . . . . . . . . . . . 18 196 (101) (1,088)
Reorganization gains, net ............................. — — — 128,155
Income (loss) before income taxes and equity income ....... 5,985 5,737 (5,283) 107,776
Income tax expense (benefit) ........................... (110) 672 (1,000) (1,166)
Equity income, net of tax and gain on disposal of
investments ...................................... 3,192 1,438 497 61
Net income (loss) ................................... 9,287 6,503 (3,786) 109,003
Net (income) loss attributable to noncontrolling interests .... (97) (331) (511) 115
Net income (loss) attributable to stockholders ........... $ 9,190 $ 6,172 $ (4,297) $109,118
Net income (loss) attributable to common stockholders .... $ 7,585 $ 4,668 $ (4,428) $109,118
Production and Vehicle Sales Volume
Management believes that production volume and vehicle sales data provide meaningful information regarding our automotive
operating results. Production volumes manufactured by our assembly facilities are generally aligned with current period net sales and
revenue, as we generally recognize revenue upon the release of the vehicle to the carrier responsible for transporting it to a dealer,
which is shortly after the completion of production. Vehicle sales data, which includes retail and fleet sales, does not correlate directly
to the revenue we recognize during the period. However, vehicle sales data is indicative of the underlying demand for our vehicles,
and is the basis for our market share.
General Motors Company 2011 Annual Report 21