General Motors 2011 Annual Report Download - page 135
Download and view the complete annual report
Please find page 135 of the 2011 General Motors annual report below. You can navigate through the pages in the report by either clicking on the pages listed below, or by using the keyword search tool below to find specific information within the annual report.-
 1
1 -
2
-
3
-
4
-
5
-
6
-
7
-
8
-
9
-
10
-
11
-
12
-
13
-
14
-
15
-
16
-
17
-
18
-
19
-
20
-
21
-
22
-
23
-
24
-
25
-
26
-
27
-
28
-
29
-
30
-
31
-
32
-
33
-
34
-
35
-
36
-
37
-
38
-
39
-
40
-
41
-
42
-
43
-
44
-
45
-
46
-
47
-
48
-
49
-
50
-
51
-
52
-
53
-
54
-
55
-
56
-
57
-
58
-
59
-
60
-
61
-
62
-
63
-
64
-
65
-
66
-
67
-
68
-
69
-
70
-
71
-
72
-
73
-
74
-
75
-
76
-
77
-
78
-
79
-
80
-
81
-
82
-
83
-
84
-
85
-
86
-
87
-
88
-
89
-
90
-
91
-
92
-
93
-
94
-
95
-
96
-
97
-
98
-
99
-
100
-
101
-
102
-
103
-
104
-
105
-
106
-
107
-
108
-
109
-
110
-
111
-
112
-
113
-
114
-
115
-
116
-
117
-
118
-
119
-
120
-
121
-
122
-
123
-
124
-
 125
125 -
 126
126 -
 127
127 -
 128
128 -
 129
129 -
 130
130 -
 131
131 -
 132
132 -
 133
133 -
 134
134 -
 135
135 -
 136
136 -
 137
137 -
 138
138 -
 139
139 -
 140
140 -
 141
141 -
 142
142 -
 143
143 -
 144
144 -
 145
145 -
146
-
147
-
148
-
149
-
150
-
151
-
152
-
153
-
154
-
155
-
156
-
157
-
158
-
159
-
160
-
161
-
162
-
163
-
164
-
165
-
166
-
167
-
168
-
169
-
170
-
171
-
172
-
173
-
174
-
175
-
176
-
177
-
178
-
179
-
180
-
181
-
182
-
183
-
184
-
185
-
186
-
187
-
188
-
189
-
190
-
191
-
192
-
193
-
194
-
195
-
196
-
197
-
198
-
199
-
200
 |
 |

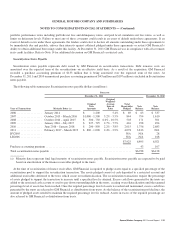
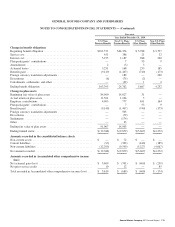
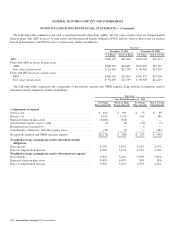
GENERAL MOTORS COMPANY AND SUBSIDIARIES
NOTES TO CONSOLIDATED FINANCIAL STATEMENTS — (Continued)
Successor
Year Ended December 31, 2010
U.S. Plans
Pension Benefits
Non-U.S. Plans
Pension Benefits
U.S. Plans
Other Benefits
Non-U.S. Plans
Other Benefits
Components of expense
Servicecost ............................................... $ 548 $ 386 $ 21 $ 32
Interest cost ............................................... 5,275 1,187 288 200
Expected return on plan assets ................................ (6,611) (987) — —
Amortization of prior service cost (credit) . . . . . . . . . . . . . . . . . . . . . . . (1) (1) 3 (9)
Recognition of net actuarial loss . . . . . . . . . . . . . . . . . . . . . . . . . . . . . . . — 21 — —
Curtailments, settlements, and other losses . . . . . . . . . . . . . . . . . . . . . . . — 60 — —
Net periodic pension and OPEB (income) expense ................ $ (789) $ 666 $ 312 $ 223
Weighted-average assumptions used to determine benefit
obligations
Discount rate .............................................. 4.96% 5.09% 5.07% 4.97%
Rate of compensation increase ................................ 3.96% 3.25% 1.41% 4.33%
Weighted-average assumptions used to determine net expense
Discount rate .............................................. 5.36% 5.19% 5.57% 5.22%
Expected return on plan assets ................................ 8.48% 7.42% 8.50% N/A
Rate of compensation increase ................................ 3.94% 3.25% 1.48% 4.45%
Successor
July 10, 2009 Through December 31, 2009
U.S. Plans
Pension Benefits
Non-U.S. Plans
Pension Benefits
U.S. Plans
Other Benefits
Non-U.S. Plans
Other Benefits
Components of expense
Servicecost ............................................... $ 254 $ 157 $ 62 $ 17
Interest cost ............................................... 2,578 602 886 94
Expected return on plan assets ................................ (3,047) (438) (432) —
Amortization of prior service cost (credit) . . . . . . . . . . . . . . . . . . . . . . . — — — (1)
Curtailments, settlements, and other losses . . . . . . . . . . . . . . . . . . . . . . . 249 9 2,580 —
Net periodic pension and OPEB expense . . . . . . . . . . . . . . . . . . . . . . . . $ 34 $ 330 $ 3,096 $ 110
Weighted-average assumptions used to determine benefit
obligations
Discount rate .............................................. 5.52% 5.31% 5.57% 5.22%
Rate of compensation increase ................................ 3.94% 3.27% 1.48% 4.45%
Weighted-average assumptions used to determine net expense
Discount rate .............................................. 5.63% 5.82% 6.81% 5.47%
Expected return on plan assets ................................ 8.50% 7.97% 8.50% N/A
Rate of compensation increase ................................ 3.94% 3.23% 1.48% 4.45%
General Motors Company 2011 Annual Report 133