General Motors 2011 Annual Report Download - page 31
Download and view the complete annual report
Please find page 31 of the 2011 General Motors annual report below. You can navigate through the pages in the report by either clicking on the pages listed below, or by using the keyword search tool below to find specific information within the annual report.-
 1
1 -
2
-
3
-
4
-
5
-
6
-
7
-
8
-
9
-
10
-
11
-
12
-
13
-
14
-
15
-
16
-
17
-
18
-
19
-
20
-
 21
21 -
 22
22 -
 23
23 -
 24
24 -
 25
25 -
 26
26 -
 27
27 -
 28
28 -
 29
29 -
 30
30 -
 31
31 -
 32
32 -
 33
33 -
 34
34 -
 35
35 -
 36
36 -
 37
37 -
 38
38 -
 39
39 -
 40
40 -
 41
41 -
42
-
43
-
44
-
45
-
46
-
47
-
48
-
49
-
50
-
51
-
52
-
53
-
54
-
55
-
56
-
57
-
58
-
59
-
60
-
61
-
62
-
63
-
64
-
65
-
66
-
67
-
68
-
69
-
70
-
71
-
72
-
73
-
74
-
75
-
76
-
77
-
78
-
79
-
80
-
81
-
82
-
83
-
84
-
85
-
86
-
87
-
88
-
89
-
90
-
91
-
92
-
93
-
94
-
95
-
96
-
97
-
98
-
99
-
100
-
101
-
102
-
103
-
104
-
105
-
106
-
107
-
108
-
109
-
110
-
111
-
112
-
113
-
114
-
115
-
116
-
117
-
118
-
119
-
120
-
121
-
122
-
123
-
124
-
125
-
126
-
127
-
128
-
129
-
130
-
131
-
132
-
133
-
134
-
135
-
136
-
137
-
138
-
139
-
140
-
141
-
142
-
143
-
144
-
145
-
146
-
147
-
148
-
149
-
150
-
151
-
152
-
153
-
154
-
155
-
156
-
157
-
158
-
159
-
160
-
161
-
162
-
163
-
164
-
165
-
166
-
167
-
168
-
169
-
170
-
171
-
172
-
173
-
174
-
175
-
176
-
177
-
178
-
179
-
180
-
181
-
182
-
183
-
184
-
185
-
186
-
187
-
188
-
189
-
190
-
191
-
192
-
193
-
194
-
195
-
196
-
197
-
198
-
199
-
200
 |
 |

GENERAL MOTORS COMPANY AND SUBSIDIARIES
Income Tax Expense (Benefit)
Successor Predecessor
Year Ended
December 31,
2011
Year Ended
December 31,
2010
July 10,
2009
Through
December 31, 2009
January 1,
2009
Through
July 9, 2009
Year Ended
2011 vs. 2010
Change
Amount %
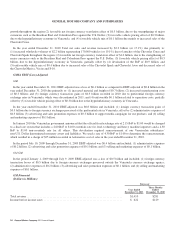
Income tax expense (benefit) ..................... $(110) $672 $(1,000) $(1,166) $(782) n.m.
n.m. = not meaningful
GM
In the year ended December 31, 2011 Income tax benefit of $0.1 billion decreased by $0.8 billion compared to Income tax expense
of $0.7 billion in 2010 due primarily to: (1) a $0.5 billion valuation allowance reversal in Australia; and (2) an increase in recognition
of previously unrecognized tax benefits of $0.2 billion which included reductions to interest expense and associated valuation
allowances.
In the year ended December 31, 2010 Income tax expense primarily resulted from current and deferred income tax provisions of
$0.6 billion for profitable entities without valuation allowances, withholding taxes and taxable foreign exchange gains in Venezuela of
$0.3 billion, partially offset by settlement of uncertain tax positions and reversal of valuation allowances of $0.3 billion.
In the period July 10, 2009 through December 31, 2009 Income tax benefit primarily resulted from a $1.4 billion income tax
allocation between income (loss) from operations and Other comprehensive income (loss), partially offset by income tax provisions of
$0.3 billion for profitable entities without valuation allowances. Our U.S. operations incurred losses from operations with no income
tax benefit due to full valuation allowances against our U.S. deferred tax assets, and we had Other comprehensive income, due
primarily to remeasurement gains on our U.S. pension plans. We recorded income tax expense related to the remeasurement gains in
Other comprehensive income and allocated income tax benefit to operations.
Old GM
In the period January 1, 2009 through July 9, 2009 Income tax benefit primarily resulted from the reversal of valuation allowances
of $0.7 billion related to Reorganization gains, net and the resolution of a transfer pricing matter of $0.7 billion with the U.S. and
Canadian governments, partially offset by income tax provisions for profitable entities without valuation allowances.
Equity Income, Net of Tax and Gain on Disposal of Investments
Successor Predecessor
Year Ended
December 31,
2011
Year Ended
December 31,
2010
July 10,
2009
Through
December 31, 2009
January 1,
2009
Through
July 9, 2009
Year Ended
2011 vs. 2010
Change
Amount %
China JVs .................................. $1,511 $1,297 $460 $ 300 $ 214 16.5%
New Delphi (including gain on disposition) ....... 1,727 117 (1) — 1,610 n.m.
Others ..................................... (46) 24 38 (239) (70) n.m.
Total equity income, net of tax and gain on disposal
of investments ............................ $3,192 $1,438 $497 $ 61 $1,754 122.0%
n.m. = not meaningful
GM
In the year ended December 31, 2011 Equity income, net of tax and gain on disposal of investments increased by $1.8 billion (or
122.0%) due primarily to a gain of $1.6 billion related to the sale of our New Delphi Class A Membership Interests and increased
equity income related to our China JVs of $0.2 billion.
General Motors Company 2011 Annual Report 29