General Motors 2011 Annual Report Download - page 41
Download and view the complete annual report
Please find page 41 of the 2011 General Motors annual report below. You can navigate through the pages in the report by either clicking on the pages listed below, or by using the keyword search tool below to find specific information within the annual report.-
 1
1 -
2
-
3
-
4
-
5
-
6
-
7
-
8
-
9
-
10
-
11
-
12
-
13
-
14
-
15
-
16
-
17
-
18
-
19
-
20
-
21
-
22
-
23
-
24
-
25
-
26
-
27
-
28
-
29
-
30
-
 31
31 -
 32
32 -
 33
33 -
 34
34 -
 35
35 -
 36
36 -
 37
37 -
 38
38 -
 39
39 -
 40
40 -
 41
41 -
 42
42 -
 43
43 -
 44
44 -
 45
45 -
 46
46 -
 47
47 -
 48
48 -
 49
49 -
 50
50 -
 51
51 -
52
-
53
-
54
-
55
-
56
-
57
-
58
-
59
-
60
-
61
-
62
-
63
-
64
-
65
-
66
-
67
-
68
-
69
-
70
-
71
-
72
-
73
-
74
-
75
-
76
-
77
-
78
-
79
-
80
-
81
-
82
-
83
-
84
-
85
-
86
-
87
-
88
-
89
-
90
-
91
-
92
-
93
-
94
-
95
-
96
-
97
-
98
-
99
-
100
-
101
-
102
-
103
-
104
-
105
-
106
-
107
-
108
-
109
-
110
-
111
-
112
-
113
-
114
-
115
-
116
-
117
-
118
-
119
-
120
-
121
-
122
-
123
-
124
-
125
-
126
-
127
-
128
-
129
-
130
-
131
-
132
-
133
-
134
-
135
-
136
-
137
-
138
-
139
-
140
-
141
-
142
-
143
-
144
-
145
-
146
-
147
-
148
-
149
-
150
-
151
-
152
-
153
-
154
-
155
-
156
-
157
-
158
-
159
-
160
-
161
-
162
-
163
-
164
-
165
-
166
-
167
-
168
-
169
-
170
-
171
-
172
-
173
-
174
-
175
-
176
-
177
-
178
-
179
-
180
-
181
-
182
-
183
-
184
-
185
-
186
-
187
-
188
-
189
-
190
-
191
-
192
-
193
-
194
-
195
-
196
-
197
-
198
-
199
-
200
 |
 |

GENERAL MOTORS COMPANY AND SUBSIDIARIES
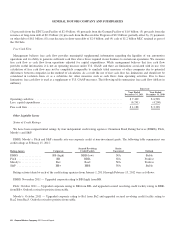
GM Financial Revenue
In the year ended December 31, 2011 Total revenue included finance charge income of $1.2 billion and other income of $0.2
billion. The effective yield on GM Financial’s finance receivables was 13.7% for the year ended December 31, 2011. The effective
yield represents finance charges and fees recorded in earnings and the accretion of the accretable yield as a percentage of average
finance receivable.
In the three months ended December 31, 2010 Total revenue included finance charge income of $0.3 billion. The effective yield on
GM Financial’s finance receivables was 12.1% for the three months ended December 31, 2010.
Net margin is the difference between finance charge income and other income earned on GM Financial’s finance receivables and
the cost to fund the receivables as well as the cost of debt incurred for general corporate purposes.
The following table summarizes GM Financial’s net margin and as a percentage of average earning assets (dollars in millions):
Successor
Year Ended
December 31, 2011
Three Months
Ended
December 31, 2010
Finance charge income and other income ........................................ $1,410 14.8% $ 281 12.8%
Interest expense ............................................................ (204) (2.2)% (37) (1.7)%
Net GM Financial margin .................................................... $1,206 12.6% $ 244 11.1%
GM Financial Income Before Income Taxes
In the year ended December 31, 2011 results included: (1) Total revenue of $1.4 billion; partially offset by (2) operating and leased
vehicle expenses of $0.4 billion; (3) interest expense of $0.2 billion; and (4) provision for loan losses of $0.2 billion. GM Financial’s
operating expenses are primarily related to personnel costs that include base salary and wages, performance incentives and benefits as
well as related employment taxes. Provisions for loan losses are charged to income to bring the allowance for loan losses to a level
which management considers adequate to absorb probable credit losses inherent in the portfolio of finance receivables originated
since October 1, 2010. Interest expense represents interest paid on GM Financial’s warehouse credit facilities, securitization notes
payable, and other unsecured debt.
Average debt outstanding in the year ended December 31, 2011 was $7.6 billion and the effective rate of interest expensed was
2.7%.
In the three months ended December 31, 2010 results included: (1) Total revenue of $0.3 billion; partially offset by (2) operating
and leased vehicle expenses of $0.1 billion; and; (3) other collectively insignificant items.
Average debt outstanding in the three months ended December 31, 2010 was $7.3 billion and the effective rate of interest expensed
was 2.0%.
General Motors Company 2011 Annual Report 39