General Motors 2011 Annual Report Download - page 150
Download and view the complete annual report
Please find page 150 of the 2011 General Motors annual report below. You can navigate through the pages in the report by either clicking on the pages listed below, or by using the keyword search tool below to find specific information within the annual report.-
 1
1 -
2
-
3
-
4
-
5
-
6
-
7
-
8
-
9
-
10
-
11
-
12
-
13
-
14
-
15
-
16
-
17
-
18
-
19
-
20
-
21
-
22
-
23
-
24
-
25
-
26
-
27
-
28
-
29
-
30
-
31
-
32
-
33
-
34
-
35
-
36
-
37
-
38
-
39
-
40
-
41
-
42
-
43
-
44
-
45
-
46
-
47
-
48
-
49
-
50
-
51
-
52
-
53
-
54
-
55
-
56
-
57
-
58
-
59
-
60
-
61
-
62
-
63
-
64
-
65
-
66
-
67
-
68
-
69
-
70
-
71
-
72
-
73
-
74
-
75
-
76
-
77
-
78
-
79
-
80
-
81
-
82
-
83
-
84
-
85
-
86
-
87
-
88
-
89
-
90
-
91
-
92
-
93
-
94
-
95
-
96
-
97
-
98
-
99
-
100
-
101
-
102
-
103
-
104
-
105
-
106
-
107
-
108
-
109
-
110
-
111
-
112
-
113
-
114
-
115
-
116
-
117
-
118
-
119
-
120
-
121
-
122
-
123
-
124
-
125
-
126
-
127
-
128
-
129
-
130
-
131
-
132
-
133
-
134
-
135
-
136
-
137
-
138
-
139
-
 140
140 -
 141
141 -
 142
142 -
 143
143 -
 144
144 -
 145
145 -
 146
146 -
 147
147 -
 148
148 -
 149
149 -
 150
150 -
 151
151 -
 152
152 -
 153
153 -
 154
154 -
 155
155 -
 156
156 -
 157
157 -
 158
158 -
 159
159 -
 160
160 -
161
-
162
-
163
-
164
-
165
-
166
-
167
-
168
-
169
-
170
-
171
-
172
-
173
-
174
-
175
-
176
-
177
-
178
-
179
-
180
-
181
-
182
-
183
-
184
-
185
-
186
-
187
-
188
-
189
-
190
-
191
-
192
-
193
-
194
-
195
-
196
-
197
-
198
-
199
-
200
 |
 |

GENERAL MOTORS COMPANY AND SUBSIDIARIES
NOTES TO CONSOLIDATED FINANCIAL STATEMENTS — (Continued)
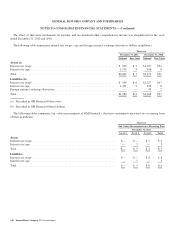
The effect of derivative instruments on earnings and Accumulated other comprehensive income was insignificant for the years
ended December 31, 2011 and 2010.
The following table summarizes interest rate swaps, caps and foreign currency exchange derivatives (dollars in millions):
Successor
December 31, 2011 December 31, 2010
Notional Fair Value Notional Fair Value
Assets (a)
Interestrateswaps .......................................................... $ 509 $ 2 $1,227 $23
Interest rate caps ............................................................ 1,513 5 946 8
Total ..................................................................... $2,022 $ 7 $2,173 $31
Liabilities (b)
Interestrateswaps .......................................................... $ 509 $ 6 $1,227 $47
Interest rate caps ............................................................ 1,471 5 832 8
Foreigncurrencyexchangederivatives .......................................... — — 49 2
Total ..................................................................... $1,980 $11 $2,108 $57
(a) Recorded in GM Financial Other assets.
(b) Recorded in GM Financial Other liabilities.
The following tables summarize fair value measurements of GM Financial’s derivative instruments measured on a recurring basis
(dollars in millions):
Successor
Fair Value Measurements on a Recurring Basis
December 31, 2011
Level 1 Level 2 Level 3 Total
Assets
Interestrateswaps .......................................................... $— $— $ 2 $ 2
Interest rate caps ............................................................ — 5 — 5
Total ..................................................................... $— $ 5 $ 2 $ 7
Liabilities
Interestrateswaps .......................................................... $— $— $ 6 $ 6
Interest rate caps ............................................................ — 5 — 5
Total ..................................................................... $— $ 5 $ 6 $11
148 General Motors Company 2011 Annual Report