General Motors 2011 Annual Report Download - page 30
Download and view the complete annual report
Please find page 30 of the 2011 General Motors annual report below. You can navigate through the pages in the report by either clicking on the pages listed below, or by using the keyword search tool below to find specific information within the annual report.-
 1
1 -
2
-
3
-
4
-
5
-
6
-
7
-
8
-
9
-
10
-
11
-
12
-
13
-
14
-
15
-
16
-
17
-
18
-
19
-
 20
20 -
 21
21 -
 22
22 -
 23
23 -
 24
24 -
 25
25 -
 26
26 -
 27
27 -
 28
28 -
 29
29 -
 30
30 -
 31
31 -
 32
32 -
 33
33 -
 34
34 -
 35
35 -
 36
36 -
 37
37 -
 38
38 -
 39
39 -
 40
40 -
41
-
42
-
43
-
44
-
45
-
46
-
47
-
48
-
49
-
50
-
51
-
52
-
53
-
54
-
55
-
56
-
57
-
58
-
59
-
60
-
61
-
62
-
63
-
64
-
65
-
66
-
67
-
68
-
69
-
70
-
71
-
72
-
73
-
74
-
75
-
76
-
77
-
78
-
79
-
80
-
81
-
82
-
83
-
84
-
85
-
86
-
87
-
88
-
89
-
90
-
91
-
92
-
93
-
94
-
95
-
96
-
97
-
98
-
99
-
100
-
101
-
102
-
103
-
104
-
105
-
106
-
107
-
108
-
109
-
110
-
111
-
112
-
113
-
114
-
115
-
116
-
117
-
118
-
119
-
120
-
121
-
122
-
123
-
124
-
125
-
126
-
127
-
128
-
129
-
130
-
131
-
132
-
133
-
134
-
135
-
136
-
137
-
138
-
139
-
140
-
141
-
142
-
143
-
144
-
145
-
146
-
147
-
148
-
149
-
150
-
151
-
152
-
153
-
154
-
155
-
156
-
157
-
158
-
159
-
160
-
161
-
162
-
163
-
164
-
165
-
166
-
167
-
168
-
169
-
170
-
171
-
172
-
173
-
174
-
175
-
176
-
177
-
178
-
179
-
180
-
181
-
182
-
183
-
184
-
185
-
186
-
187
-
188
-
189
-
190
-
191
-
192
-
193
-
194
-
195
-
196
-
197
-
198
-
199
-
200
 |
 |

GENERAL MOTORS COMPANY AND SUBSIDIARIES
GM
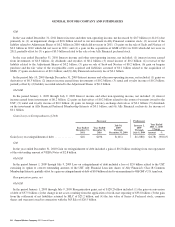
In the year ended December 31, 2011 Interest income and other non-operating income, net decreased by $0.7 billion (or 44.4%) due
primarily to: (1) an impairment charge of $0.6 billion related to our investment in Ally Financial common stock; (2) reversal of the
liability related to Adjustment Shares of $0.2 billion in 2010 which did not recur in 2011; (3) gains on the sale of Saab and Nexteer of
$0.2 billion in 2010 which did not recur in 2011; and (4) a gain on the acquisition of GMS of $0.1 in 2010 which did not recur in
2011; partially offset by (5) a gain of $0.3 billion related to the sale of our Ally Financial preferred stock.
In the year ended December 31, 2010 Interest income and other non-operating income, net included; (1) interest income earned
from investments of $0.5 billion; (2) dividends and royalties of $0.2 billion; (3) rental income of $0.2 billion; (4) reversal of the
liability related to the Adjustment Shares of $0.2 billion; (5) gain on sale of Saab and Nexteer of $0.2 billion; (6) gain on bargain
purchase and the fair value of the recognizable assets acquired and liabilities assumed of $0.1 billion related to the acquisition of
GMS; (7) gains on derivatives of $0.1 billion; and (8) Ally Financial exclusivity fee of $0.1 billion.
In the period July 10, 2009 through December 31, 2009 Interest income and other non-operating income, net included: (1) gains on
derivatives of $0.3 billion; (2) interest income earned from investments of $0.2 billion; (3) rental and royalty income of $0.2 billion;
partially offset by (4) liability recorded related to the Adjustment Shares of $0.2 billion.
Old GM
In the period January 1, 2009 through July 9, 2009 Interest income and other non-operating income, net included: (1) interest
income earned from investments of $0.2 billion; (2) gains on derivatives of $0.2 billion related to the return of warrants issued to the
UST; (3) rental and royalty income of $0.2 billion; (4) gains on foreign currency exchange derivatives of $0.1 billion; (5) dividends
on the investment in Ally Financial Preferred Membership Interests of $0.1 billion; and (6) Ally Financial exclusivity fee income of
$0.1 billion.
Gain (Loss) on Extinguishment of Debt
Successor Predecessor
Year Ended
December 31,
2011
Year Ended
December 31,
2010
July 10,
2009
Through
December 31, 2009
January 1,
2009
Through
July 9, 2009
Year Ended
2011 vs. 2010
Change
Amount %
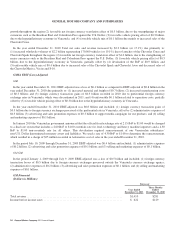
Gain (loss) on extinguishment of debt . . . . . . . . . . . . . $18 $196 $(101) $(1,088) $(178) (90.8)%
GM
In the year ended December 31, 2010 Gain on extinguishment of debt included a gain of $0.2 billion resulting from our repayment
of the outstanding amount of VEBA Notes of $2.8 billion.
Old GM
In the period January 1, 2009 through July 9, 2009 Loss on extinguishment of debt included a loss of $2.0 billion related to the UST
exercising its option to convert outstanding amounts of the UST Ally Financial Loan into shares of Ally Financial’s Class B Common
Membership Interests; partially offset by a gain on extinguishment of debt of $0.9 billion related to an amendment to Old GM’s U.S. term loan.
Reorganization gains, net
Old GM
In the period January 1, 2009 through July 9, 2009 Reorganization gains, net of $128.2 billion included: (1) the gain on conversion
of debt of $37.5 billion; (2) the change in net assets resulting from the application of fresh-start reporting of $33.8 billion; (3) the gain
from the settlement of net liabilities retained by MLC of $25.2 billion; and (4) the fair value of Series A Preferred stock, common
shares and warrants issued in connection with the 363 Sale of $20.5 billion.
28 General Motors Company 2011 Annual Report