General Motors 2011 Annual Report Download - page 37
Download and view the complete annual report
Please find page 37 of the 2011 General Motors annual report below. You can navigate through the pages in the report by either clicking on the pages listed below, or by using the keyword search tool below to find specific information within the annual report.-
 1
1 -
2
-
3
-
4
-
5
-
6
-
7
-
8
-
9
-
10
-
11
-
12
-
13
-
14
-
15
-
16
-
17
-
18
-
19
-
20
-
21
-
22
-
23
-
24
-
25
-
26
-
 27
27 -
 28
28 -
 29
29 -
 30
30 -
 31
31 -
 32
32 -
 33
33 -
 34
34 -
 35
35 -
 36
36 -
 37
37 -
 38
38 -
 39
39 -
 40
40 -
 41
41 -
 42
42 -
 43
43 -
 44
44 -
 45
45 -
 46
46 -
 47
47 -
48
-
49
-
50
-
51
-
52
-
53
-
54
-
55
-
56
-
57
-
58
-
59
-
60
-
61
-
62
-
63
-
64
-
65
-
66
-
67
-
68
-
69
-
70
-
71
-
72
-
73
-
74
-
75
-
76
-
77
-
78
-
79
-
80
-
81
-
82
-
83
-
84
-
85
-
86
-
87
-
88
-
89
-
90
-
91
-
92
-
93
-
94
-
95
-
96
-
97
-
98
-
99
-
100
-
101
-
102
-
103
-
104
-
105
-
106
-
107
-
108
-
109
-
110
-
111
-
112
-
113
-
114
-
115
-
116
-
117
-
118
-
119
-
120
-
121
-
122
-
123
-
124
-
125
-
126
-
127
-
128
-
129
-
130
-
131
-
132
-
133
-
134
-
135
-
136
-
137
-
138
-
139
-
140
-
141
-
142
-
143
-
144
-
145
-
146
-
147
-
148
-
149
-
150
-
151
-
152
-
153
-
154
-
155
-
156
-
157
-
158
-
159
-
160
-
161
-
162
-
163
-
164
-
165
-
166
-
167
-
168
-
169
-
170
-
171
-
172
-
173
-
174
-
175
-
176
-
177
-
178
-
179
-
180
-
181
-
182
-
183
-
184
-
185
-
186
-
187
-
188
-
189
-
190
-
191
-
192
-
193
-
194
-
195
-
196
-
197
-
198
-
199
-
200
 |
 |

GENERAL MOTORS COMPANY AND SUBSIDIARIES
pension plans as a result of the 2009 Special Attrition Programs and salaried workforce reductions; (3) U.S. hourly and salary
separation program charges and Canadian restructuring activities of $1.1 billion; (4) foreign currency remeasurement losses of $0.7
billion due to the strengthening of the Canadian Dollar against the U.S. Dollar; (5) charges of $0.5 billion incurred for dealer wind-
down costs; (6) derivative losses of $0.5 billion related to commodity and foreign currency exchange derivatives; (7) a net charge of
$0.4 billion related to the modification of UAW job security programs; (8) charges of $0.4 billion primarily for impairments of long-
lived assets; (9) charges of $0.3 billion related to obligations associated with various Delphi agreements; and (10) equity losses of
$0.3 billion related to impairment charges and our proportionate share of losses at joint ventures.
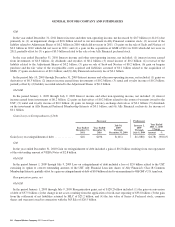
GM Europe
(Dollars in Millions)
Successor
Combined GM
and Old GM Successor Predecessor
Year Ended
December 31,
2011
Year Ended
December 31,
2010
Year Ended
December 31,
2009
July 10, 2009
Through
December 31,
2009
January 1,
2009
Through
July 9, 2009
Year Ended
2011 vs. 2010
Change
Year Ended
2010 vs. 2009
Change
Amount % Amount %
Total net sales and revenue . . $26,757 $24,076 $24,031 $11,479 $12,552 $2,681 11.1% $45 0.2%
EBIT (loss)-adjusted ....... $ (747) $ (1,953) $ (814) $ (2,815) $1,206 61.8%
GME Total Net Sales and Revenue
In the year ended December 31, 2011 Total net sales and revenue increased by $2.7 billion (or 11.1%) due primarily to:
(1) favorable foreign currency translation effect of $1.1 billion, due to the strengthening of the Euro, British Pound and Swiss Franc
against the U.S. Dollar; (2) favorable vehicle mix of $1.1 billion due to the new generation Opel Meriva and Opel Astra and increased
sales of other higher priced vehicles; (3) revenue from GMS of $0.4 billion, which we acquired in 2010; (4) increased powertrain
engine and transmission sales of $0.3 billion, in support of the Chevrolet Cruze and Chevrolet Volt; (5) increased components sales of
$0.2 billion; and (6) increased volumes of $0.1 billion due primarily to a 16,000 vehicles (or 1.3%) increase in wholesales; partially
offset by (7) a reduction in Saab brand sales of $0.2 billion related to the sale of Saab in 2010; and (8) a decrease of $0.1 billion due to
the deconsolidation of VMM in June 2011.
In the year ended December 31, 2010 Total net sales and revenue increased by $45 million (or 0.2%) due primarily to: (1) increased
volumes of $0.3 billion due primarily to a 38,000 vehicles (or 3.1%) increase in wholesales, which included a decrease of $0.5 billion
representing 17,000 vehicles due to the sale of Saab in February 2010; (2) favorable vehicle mix of $0.5 billion due to the Opel
Insignia and increased sales of other higher priced vehicles; (3) favorable vehicle pricing effect of $0.5 billion due to launches of the
Opel Astra and Opel Meriva; partially offset by (4) unfavorable net foreign currency translation effect of $0.7 billion, due to the
weakening of the Euro and British Pound against the U.S. Dollar.
GME EBIT (Loss)-Adjusted
GM
In the year ended December 31, 2011 EBIT (loss)-adjusted decreased by $1.2 billion (or 61.8%) due primarily to: (1) higher
restructuring charges of $0.5 billion recorded in 2010 for separation programs in Belgium, Spain, Germany and the United Kingdom;
(2) decreased manufacturing costs of $0.3 billion related to the closing of the Antwerp, Belgium facility and European wide labor
savings; (3) favorable net vehicle mix of $0.2 billion; (4) an increase of $0.2 billion in an embedded foreign currency exchange
derivative asset associated with a long-term supply agreement entered into in 2010; (5) EBIT-adjusted from GMS of $0.1 billion;
offset by (6) unfavorable net foreign currency effects of $0.1 billion; and (7) charges of $0.1 billion related to a single customer’s
default under various commercial supply agreements.
General Motors Company 2011 Annual Report 35