General Motors 2011 Annual Report Download - page 137
Download and view the complete annual report
Please find page 137 of the 2011 General Motors annual report below. You can navigate through the pages in the report by either clicking on the pages listed below, or by using the keyword search tool below to find specific information within the annual report.-
 1
1 -
2
-
3
-
4
-
5
-
6
-
7
-
8
-
9
-
10
-
11
-
12
-
13
-
14
-
15
-
16
-
17
-
18
-
19
-
20
-
21
-
22
-
23
-
24
-
25
-
26
-
27
-
28
-
29
-
30
-
31
-
32
-
33
-
34
-
35
-
36
-
37
-
38
-
39
-
40
-
41
-
42
-
43
-
44
-
45
-
46
-
47
-
48
-
49
-
50
-
51
-
52
-
53
-
54
-
55
-
56
-
57
-
58
-
59
-
60
-
61
-
62
-
63
-
64
-
65
-
66
-
67
-
68
-
69
-
70
-
71
-
72
-
73
-
74
-
75
-
76
-
77
-
78
-
79
-
80
-
81
-
82
-
83
-
84
-
85
-
86
-
87
-
88
-
89
-
90
-
91
-
92
-
93
-
94
-
95
-
96
-
97
-
98
-
99
-
100
-
101
-
102
-
103
-
104
-
105
-
106
-
107
-
108
-
109
-
110
-
111
-
112
-
113
-
114
-
115
-
116
-
117
-
118
-
119
-
120
-
121
-
122
-
123
-
124
-
125
-
126
-
 127
127 -
 128
128 -
 129
129 -
 130
130 -
 131
131 -
 132
132 -
 133
133 -
 134
134 -
 135
135 -
 136
136 -
 137
137 -
 138
138 -
 139
139 -
 140
140 -
 141
141 -
 142
142 -
 143
143 -
 144
144 -
 145
145 -
 146
146 -
 147
147 -
148
-
149
-
150
-
151
-
152
-
153
-
154
-
155
-
156
-
157
-
158
-
159
-
160
-
161
-
162
-
163
-
164
-
165
-
166
-
167
-
168
-
169
-
170
-
171
-
172
-
173
-
174
-
175
-
176
-
177
-
178
-
179
-
180
-
181
-
182
-
183
-
184
-
185
-
186
-
187
-
188
-
189
-
190
-
191
-
192
-
193
-
194
-
195
-
196
-
197
-
198
-
199
-
200
 |
 |

GENERAL MOTORS COMPANY AND SUBSIDIARIES
NOTES TO CONSOLIDATED FINANCIAL STATEMENTS — (Continued)
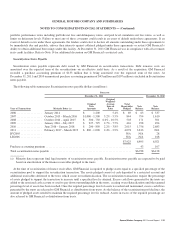
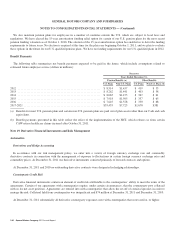
The following table summarizes the effect of a one-percentage point change in the assumed healthcare trend rates (dollars in
millions):
Successor
Non-U.S. Plans
Change in Assumption
Effect on 2011
Aggregate Service
and Interest Cost
Effect on
December 31, 2010
APBO
Onepercentagepointincrease ...................................................... $31 $491
One percentage point decrease ...................................................... $(25) $(392)
Investment Strategies and Long-Term Rate of Return
Detailed periodic studies conducted by outside actuaries and an internal asset management group, consisting of an analysis of
capital market assumptions and employing Monte-Carlo simulations, are used to determine the long-term strategic mix among asset
classes, risk mitigation strategies, and the expected return on asset assumptions for U.S. pension plans. The U.S. study includes a
review of alternative asset allocation and risk mitigation strategies, anticipated future long-term performance of individual asset
classes, risks evaluated using standard deviation techniques and correlations among the asset classes that comprise the plans’ asset
mix. Similar studies are performed for the significant non-U.S. pension plans with the assistance of outside actuaries and asset
managers. While the studies incorporate data from recent fund performance and historical returns, the expected return on plan asset
assumptions are determined based on long-term, prospective rates of return.
The strategic asset mix and risk mitigation strategies for the plans are tailored specifically for each plan. Individual plans have
distinct liabilities, liquidity needs, and regulatory requirements. Consequently, there are different investment policies set by individual
plan fiduciaries. Although investment policies and risk mitigation strategies may differ among plans, each investment strategy is
considered to be optimal in the context of the specific factors affecting each plan.
In setting new strategic asset mixes, consideration is given to the likelihood that the selected mixes will effectively fund the
projected pension plan liabilities, while aligning with the risk tolerance of the plans’ fiduciaries. The strategic asset mixes for U.S.
defined benefit pension plans are increasingly designed to satisfy the complementary objectives of reaching fully funded positions
(market value of assets equal to or greater than the present value of the liabilities) and mitigating the possibility of a deterioration in
funded status.
Derivatives may be used to provide cost effective solutions for rebalancing investment portfolios, increasing or decreasing exposure
to various asset classes and for mitigating risks, primarily interest rate and currency risks. Equity and fixed income managers are
permitted to utilize derivatives as efficient substitutes for traditional physical securities. Interest rate derivatives may be used to adjust
portfolio duration to align with a plan’s targeted investment policy. Alternative investment managers are permitted to employ
leverage, including through the use of derivatives, which may alter economic exposure.
In December 2011 an analysis of the investment policy was completed for the U.S. pension plans considering: (1) our overall
balance sheet derisking strategy; (2) the plans are closed to new participants; and (3) the 2011 UAW negotiations did not increase
pension benefits. Separate long-term strategies were developed for the salaried and hourly U.S. pension plans which represent 35%
and 65% of total U.S. pension plans’ assets. Using an approach which matches plan assets and liability cash flows to minimize risk of
funded status volatility, the expected weighted-average return on assets was reduced from 8.0% at December 31, 2010 to 5.7% for the
salaried pension plan and to 6.5% for the hourly pension plan. The resulting weighted-average return is 6.2% The overall decrease is
primarily due to a different asset mix consisting of a higher proportion of fixed income investments compared to last year. The
salaried pension plan has a higher target proportion of fixed income investments than the hourly pension plan and therefore, a lower
expected return on assets than the hourly pension plan.
General Motors Company 2011 Annual Report 135