General Motors 2011 Annual Report Download - page 78
Download and view the complete annual report
Please find page 78 of the 2011 General Motors annual report below. You can navigate through the pages in the report by either clicking on the pages listed below, or by using the keyword search tool below to find specific information within the annual report.-
 1
1 -
2
-
3
-
4
-
5
-
6
-
7
-
8
-
9
-
10
-
11
-
12
-
13
-
14
-
15
-
16
-
17
-
18
-
19
-
20
-
21
-
22
-
23
-
24
-
25
-
26
-
27
-
28
-
29
-
30
-
31
-
32
-
33
-
34
-
35
-
36
-
37
-
38
-
39
-
40
-
41
-
42
-
43
-
44
-
45
-
46
-
47
-
48
-
49
-
50
-
51
-
52
-
53
-
54
-
55
-
56
-
57
-
58
-
59
-
60
-
61
-
62
-
63
-
64
-
65
-
66
-
67
-
 68
68 -
 69
69 -
 70
70 -
 71
71 -
 72
72 -
 73
73 -
 74
74 -
 75
75 -
 76
76 -
 77
77 -
 78
78 -
 79
79 -
 80
80 -
 81
81 -
 82
82 -
 83
83 -
 84
84 -
 85
85 -
 86
86 -
 87
87 -
 88
88 -
89
-
90
-
91
-
92
-
93
-
94
-
95
-
96
-
97
-
98
-
99
-
100
-
101
-
102
-
103
-
104
-
105
-
106
-
107
-
108
-
109
-
110
-
111
-
112
-
113
-
114
-
115
-
116
-
117
-
118
-
119
-
120
-
121
-
122
-
123
-
124
-
125
-
126
-
127
-
128
-
129
-
130
-
131
-
132
-
133
-
134
-
135
-
136
-
137
-
138
-
139
-
140
-
141
-
142
-
143
-
144
-
145
-
146
-
147
-
148
-
149
-
150
-
151
-
152
-
153
-
154
-
155
-
156
-
157
-
158
-
159
-
160
-
161
-
162
-
163
-
164
-
165
-
166
-
167
-
168
-
169
-
170
-
171
-
172
-
173
-
174
-
175
-
176
-
177
-
178
-
179
-
180
-
181
-
182
-
183
-
184
-
185
-
186
-
187
-
188
-
189
-
190
-
191
-
192
-
193
-
194
-
195
-
196
-
197
-
198
-
199
-
200
 |
 |

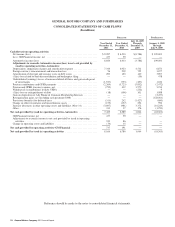
GENERAL MOTORS COMPANY AND SUBSIDIARIES
CONSOLIDATED STATEMENTS OF CASH FLOWS
(In millions)
Successor Predecessor
Year Ended
December 31,
2011
Year Ended
December 31,
2010
July 10, 2009
Through
December 31,
2009
January 1, 2009
Through
July 9, 2009
Cash flows from operating activities
Net income (loss) ..................................................... $9,287 $ 6,503 $(3,786) $ 109,003
Less:GMFinancialincome,net ......................................... 437 90 — —
Automotive income (loss) .............................................. 8,850 6,413 (3,786) 109,003
Adjustments to reconcile Automotive income (loss) to net cash provided by
(used in) operating activities–Automotive
Depreciation, impairment charges and amortization expense ................... 7,344 6,923 4,511 6,873
Foreign currency remeasurement and transaction loss . . . . . . . . . . . . . . . . . . . . . . . . 56 209 755 1,077
Amortization of discount and issuance costs on debt issues . . . . . . . . . . . . . . . . . . . . 200 163 140 3,897
(Gain) loss related to Saab deconsolidation and bankruptcy filing ............... — — (59) 478
Undistributed (earnings) losses of nonconsolidated affiliates and gain on disposal
of investments ..................................................... (1,947) (753) (497) 1,036
Pension contributions and OPEB payments ................................ (2,269) (5,723) (5,832) (2,472)
Pension and OPEB (income) expense, net .................................. (755) 412 3,570 3,234
Withdrawals (contributions) from/to VEBA ................................ — — (252) 9
(Gain) loss on extinguishment of debt ..................................... (18) (196) 101 1,088
Gain on disposition of Ally Financial Common Membership Interests ........... — — — (2,477)
Reorganization gains, net (including cash payments $408) .................... — — — (128,563)
Provisions (benefits) for deferred taxes .................................... (311) 242 (1,427) (600)
Change in other investments and miscellaneous assets ........................ (155) (137) 292 596
Increase (decrease) in other operating assets and liabilities (Note 31) ............ (3,897) (981) 3,372 (10,229)
Other............................................................... 331 17 176 (1,253)
Net cash provided by (used in) operating activities–Automotive ............... 7,429 6,589 1,064 (18,303)
GMFinancialincome,net .............................................. 437 90 — —
Adjustments to reconcile income to net cash provided by (used in) operating
activities .......................................................... 370 86 — —
Change in operating assets and liabilities .................................. (70) 15 — —
Net cash provided by operating activities–GM Financial ..................... 737 191 — —
Net cash provided by (used in) operating activities .......................... 8,166 6,780 1,064 (18,303)
Reference should be made to the notes to consolidated financial statements.
76 General Motors Company 2011 Annual Report