General Motors 2011 Annual Report Download - page 142
Download and view the complete annual report
Please find page 142 of the 2011 General Motors annual report below. You can navigate through the pages in the report by either clicking on the pages listed below, or by using the keyword search tool below to find specific information within the annual report.-
 1
1 -
2
-
3
-
4
-
5
-
6
-
7
-
8
-
9
-
10
-
11
-
12
-
13
-
14
-
15
-
16
-
17
-
18
-
19
-
20
-
21
-
22
-
23
-
24
-
25
-
26
-
27
-
28
-
29
-
30
-
31
-
32
-
33
-
34
-
35
-
36
-
37
-
38
-
39
-
40
-
41
-
42
-
43
-
44
-
45
-
46
-
47
-
48
-
49
-
50
-
51
-
52
-
53
-
54
-
55
-
56
-
57
-
58
-
59
-
60
-
61
-
62
-
63
-
64
-
65
-
66
-
67
-
68
-
69
-
70
-
71
-
72
-
73
-
74
-
75
-
76
-
77
-
78
-
79
-
80
-
81
-
82
-
83
-
84
-
85
-
86
-
87
-
88
-
89
-
90
-
91
-
92
-
93
-
94
-
95
-
96
-
97
-
98
-
99
-
100
-
101
-
102
-
103
-
104
-
105
-
106
-
107
-
108
-
109
-
110
-
111
-
112
-
113
-
114
-
115
-
116
-
117
-
118
-
119
-
120
-
121
-
122
-
123
-
124
-
125
-
126
-
127
-
128
-
129
-
130
-
131
-
 132
132 -
 133
133 -
 134
134 -
 135
135 -
 136
136 -
 137
137 -
 138
138 -
 139
139 -
 140
140 -
 141
141 -
 142
142 -
 143
143 -
 144
144 -
 145
145 -
 146
146 -
 147
147 -
 148
148 -
 149
149 -
 150
150 -
 151
151 -
 152
152 -
153
-
154
-
155
-
156
-
157
-
158
-
159
-
160
-
161
-
162
-
163
-
164
-
165
-
166
-
167
-
168
-
169
-
170
-
171
-
172
-
173
-
174
-
175
-
176
-
177
-
178
-
179
-
180
-
181
-
182
-
183
-
184
-
185
-
186
-
187
-
188
-
189
-
190
-
191
-
192
-
193
-
194
-
195
-
196
-
197
-
198
-
199
-
200
 |
 |

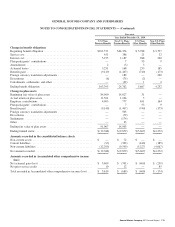
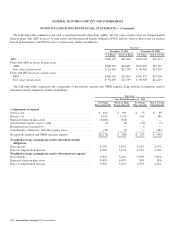
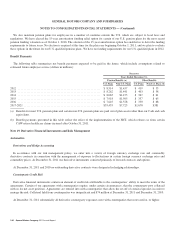
GENERAL MOTORS COMPANY AND SUBSIDIARIES
NOTES TO CONSOLIDATED FINANCIAL STATEMENTS — (Continued)
Balance at
January 1,
2010
Net
Realized/
Unrealized
Gains
(Loss)
Purchases,
Sales and
Settlements,
Net
Transfers
Into/
Out
of Level 3
Balance at
December 31,
2010
Change in
Unrealized
Gains/
(Losses)
Attributable
to Assets
Held at
December 31,
2010
Assets
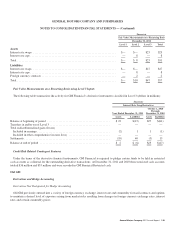
Common and preferred stocks . . . . . . . . . . . . . . . . . . . . . . . $ 53 $ 3 $ 4 $ 4 $ 64 $ 23
Government and agency debt securities ................ 1,501 9 (112) (1,323) 75 (8)
Corporate debt securities ........................... 1,747 51 (526) (710) 562 56
Agency mortgage and asset-backed securities . . . . . . . . . . . 6 — (1) (5) — —
Non-agency mortgage and asset-backed securities ....... 1,520 144 (172) (671) 821 393
Group annuity contracts ............................ 3,301 66 (252) — 3,115 (95)
Investment funds
Equityfunds ................................... 576 15 7 (216) 382 (1)
Fixed income funds ............................. 6,488 230 (307) (4,124) 2,287 136
Funds of hedge funds ............................ 4,435 428 1,520 (39) 6,344 103
Global macro funds . . . . . . . . . . . . . . . . . . . . . . . . . . . . . 711 11 (606) (112) 4 103
Multi-strategy funds ............................. 1,809 385 1,521 (169) 3,546 359
Other investment funds . . . . . . . . . . . . . . . . . . . . . . . . . . 456 (31) (160) (79) 186 (2)
Private equity and debt investments ................... 6,940 1,168 (71) — 8,037 578
Real estate investments ............................ 4,836 580 92 — 5,508 523
Total assets ...................................... 34,379 3,059 937 (7,444) 30,931 2,168
Liabilities
Common and preferred stocks . . . . . . . . . . . . . . . . . . . . . . . (2) — — 2 — —
Corporate debt securities . . . . . . . . . . . . . . . . . . . . . . . . . . . (3) — — 1 (2) —
Totalliabilities ................................... (5) — — 3 (2) —
Derivatives, net
Interest rate contracts . . . . . . . . . . . . . . . . . . . . . . . . . . . . 92 (18) (2) (90) (18) (18)
Foreign currency exchange contracts ................ — — 1 — 1 —
Equity contracts ................................ (15) (16) (10) — (41) (16)
Credit contracts . . . . . . . . . . . . . . . . . . . . . . . . . . . . . . . . 35 (17) (27) 8 (1) (20)
Total net assets ................................... $34,486 $3,008 $ 899 $(7,523) $30,870 $2,114
140 General Motors Company 2011 Annual Report