General Motors 2011 Annual Report Download - page 26
Download and view the complete annual report
Please find page 26 of the 2011 General Motors annual report below. You can navigate through the pages in the report by either clicking on the pages listed below, or by using the keyword search tool below to find specific information within the annual report.-
 1
1 -
2
-
3
-
4
-
5
-
6
-
7
-
8
-
9
-
10
-
11
-
12
-
13
-
14
-
15
-
 16
16 -
 17
17 -
 18
18 -
 19
19 -
 20
20 -
 21
21 -
 22
22 -
 23
23 -
 24
24 -
 25
25 -
 26
26 -
 27
27 -
 28
28 -
 29
29 -
 30
30 -
 31
31 -
 32
32 -
 33
33 -
 34
34 -
 35
35 -
 36
36 -
37
-
38
-
39
-
40
-
41
-
42
-
43
-
44
-
45
-
46
-
47
-
48
-
49
-
50
-
51
-
52
-
53
-
54
-
55
-
56
-
57
-
58
-
59
-
60
-
61
-
62
-
63
-
64
-
65
-
66
-
67
-
68
-
69
-
70
-
71
-
72
-
73
-
74
-
75
-
76
-
77
-
78
-
79
-
80
-
81
-
82
-
83
-
84
-
85
-
86
-
87
-
88
-
89
-
90
-
91
-
92
-
93
-
94
-
95
-
96
-
97
-
98
-
99
-
100
-
101
-
102
-
103
-
104
-
105
-
106
-
107
-
108
-
109
-
110
-
111
-
112
-
113
-
114
-
115
-
116
-
117
-
118
-
119
-
120
-
121
-
122
-
123
-
124
-
125
-
126
-
127
-
128
-
129
-
130
-
131
-
132
-
133
-
134
-
135
-
136
-
137
-
138
-
139
-
140
-
141
-
142
-
143
-
144
-
145
-
146
-
147
-
148
-
149
-
150
-
151
-
152
-
153
-
154
-
155
-
156
-
157
-
158
-
159
-
160
-
161
-
162
-
163
-
164
-
165
-
166
-
167
-
168
-
169
-
170
-
171
-
172
-
173
-
174
-
175
-
176
-
177
-
178
-
179
-
180
-
181
-
182
-
183
-
184
-
185
-
186
-
187
-
188
-
189
-
190
-
191
-
192
-
193
-
194
-
195
-
196
-
197
-
198
-
199
-
200
 |
 |

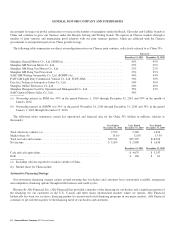
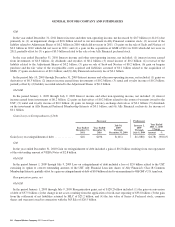
GENERAL MOTORS COMPANY AND SUBSIDIARIES
Total Net Sales and Revenue
(Dollars in Millions)
Successor
Combined GM
and Old GM Successor Predecessor
Year Ended
December 31,
2011
Year Ended
December 31,
2010
Year Ended
December 31,
2009
July 10, 2009
Through
December 31,
2009
January 1, 2009
Through
July 9, 2009
Year Ended
2011 vs. 2010
Change
Year Ended
2010 vs. 2009
Change
Amount % Amount %
GMNA ................. $ 90,233 $ 83,035 $ 56,617 $32,426 $24,191 $ 7,198 8.7% $ 26,418 46.7%
GME . . . . . . . . . . . . . . . . . . . 26,757 24,076 24,031 11,479 12,552 2,681 11.1% 45 0.2%
GMIO .................. 24,761 20,561 14,345 8,127 6,218 4,200 20.4% 6,216 43.3%
GMSA ................. 16,877 15,379 13,135 7,399 5,736 1,498 9.7% 2,244 17.1%
GM Financial ............ 1,410 281 1,129 n.m. 281 n.m.
Total operating segments . . . 160,038 143,332 108,128 59,431 48,697 16,706 11.7% 35,204 32.6%
Corporate and
eliminations ........... (9,762) (7,740) (3,539) (1,957) (1,582) (2,022) (26.1)% (4,201) (118.7)%
Total net sales and
revenue ............... $150,276 $135,592 $104,589 $57,474 $47,115 $14,684 10.8% $ 31,003 29.6%
n.m. = not meaningful
In the year ended December 31, 2011 Total net sales and revenue increased by $14.7 billion (or 10.8%) due primarily to:
(1) increased wholesale volumes of $8.6 billion representing 403,000 vehicles; (2) net foreign currency translation and remeasurement
gains of $2.6 billion due to the strengthening of major currencies against the U.S. Dollar; (3) favorable vehicle pricing effect of $1.6
billion due to model year price increases and reduced sales allowances; (4) increased finance income of $1.1 billion due to the
acquisition of GM Financial; (5) increased revenues from powertrain and parts sales of $1.1 billion due to increased volumes;
(6) favorable vehicle mix of $0.6 billion; and (7) increased revenue of $0.4 billion due to the acquisition of General Motors
Strasbourg S.A.S. (GMS); partially offset by (8) decreased revenue of $1.0 billion due to the sale of Nexteer in November 2010.
In the year ended December 31, 2010 Total net sales and revenue increased by $31.0 billion (or 29.6%) due primarily to:
(1) increased wholesale sales volume of $21.8 billion representing 1.1 million vehicles; (2) favorable vehicle pricing effect of $3.7
billion; (3) favorable vehicle mix of $2.6 billion; (4) net foreign currency translation and remeasurement gains of $1.8 billion;
(5) increased sales of $1.0 billion due to the acquisition of Nexteer and four domestic component manufacturing facilities;
(6) derivative losses of $0.8 billion in 2009 that did not recur in 2010; (7) increased revenues from OnStar of $0.3 billion; and
(8) finance charge income of $0.3 billion due to the acquisition of AmeriCredit Corp. (AmeriCredit); partially offset by
(9) devaluation of the BsF of $0.9 billion; and (10) decreased lease financing revenues of $0.3 billion related to the liquidation of the
portfolio of automotive leases.
Automotive Cost of Sales
Successor Predecessor
Year Ended
December 31,
2011
Year Ended
December 31,
2010
July 10, 2009
Through
December 31,
2009
January 1, 2009
Through
July 9, 2009
Year Ended
2011 vs. 2010
Change
Amount %
Automotive cost of sales ..................... $130,386 $118,768 $56,316 $55,814 $11,618 9.8%
Automotive gross margin ..................... $ 18,480 $ 16,543 $ 1,158 $ (8,699) $ 1,937 11.7%
24 General Motors Company 2011 Annual Report