General Motors 2011 Annual Report Download - page 176
Download and view the complete annual report
Please find page 176 of the 2011 General Motors annual report below. You can navigate through the pages in the report by either clicking on the pages listed below, or by using the keyword search tool below to find specific information within the annual report.-
 1
1 -
2
-
3
-
4
-
5
-
6
-
7
-
8
-
9
-
10
-
11
-
12
-
13
-
14
-
15
-
16
-
17
-
18
-
19
-
20
-
21
-
22
-
23
-
24
-
25
-
26
-
27
-
28
-
29
-
30
-
31
-
32
-
33
-
34
-
35
-
36
-
37
-
38
-
39
-
40
-
41
-
42
-
43
-
44
-
45
-
46
-
47
-
48
-
49
-
50
-
51
-
52
-
53
-
54
-
55
-
56
-
57
-
58
-
59
-
60
-
61
-
62
-
63
-
64
-
65
-
66
-
67
-
68
-
69
-
70
-
71
-
72
-
73
-
74
-
75
-
76
-
77
-
78
-
79
-
80
-
81
-
82
-
83
-
84
-
85
-
86
-
87
-
88
-
89
-
90
-
91
-
92
-
93
-
94
-
95
-
96
-
97
-
98
-
99
-
100
-
101
-
102
-
103
-
104
-
105
-
106
-
107
-
108
-
109
-
110
-
111
-
112
-
113
-
114
-
115
-
116
-
117
-
118
-
119
-
120
-
121
-
122
-
123
-
124
-
125
-
126
-
127
-
128
-
129
-
130
-
131
-
132
-
133
-
134
-
135
-
136
-
137
-
138
-
139
-
140
-
141
-
142
-
143
-
144
-
145
-
146
-
147
-
148
-
149
-
150
-
151
-
152
-
153
-
154
-
155
-
156
-
157
-
158
-
159
-
160
-
161
-
162
-
163
-
164
-
165
-
 166
166 -
 167
167 -
 168
168 -
 169
169 -
 170
170 -
 171
171 -
 172
172 -
 173
173 -
 174
174 -
 175
175 -
 176
176 -
 177
177 -
 178
178 -
 179
179 -
 180
180 -
 181
181 -
 182
182 -
 183
183 -
 184
184 -
 185
185 -
 186
186 -
187
-
188
-
189
-
190
-
191
-
192
-
193
-
194
-
195
-
196
-
197
-
198
-
199
-
200
 |
 |

GENERAL MOTORS COMPANY AND SUBSIDIARIES
NOTES TO CONSOLIDATED FINANCIAL STATEMENTS — (Continued)
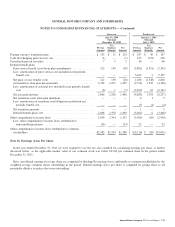
The following table summarizes basic and dilutive earnings (loss) per share (in millions, except for per share amounts):
Successor Predecessor
Year Ended
December 31,
2011
Year Ended
December 31,
2010
July 10, 2009
Through
December 31,
2009
January 1, 2009
Through
July 9, 2009
Basic earnings (loss) per share
Net income (loss) attributable to stockholders (a) ................... $9,190 $6,172 $(4,297) $109,118
Less: cumulative dividends on and charge related to purchase of
preferred stock and undistributed earnings allocated to Series B
Preferred Stock participating security (b) ........................ 1,605 1,504 131 —
Net income (loss) attributable to common stockholders ............... $7,585 $4,668 $(4,428) $109,118
Weighted-average common shares outstanding — basic ........... 1,536 1,500 1,238 611
Basic earnings (loss) per share .................................. $ 4.94 $ 3.11 $ (3.58) $ 178.63
Diluted earnings (loss) per share
Net income (loss) attributable to stockholders (a) ................... $9,190 $6,172 $(4,297) $109,118
Add: preferred dividends to holders of Series B Preferred Stock . . . . . . . . — 25 — —
Less: cumulative dividends on and charge related to purchase of
preferred stock and undistributed earnings allocated to Series B
Preferred Stock participating security (c) ........................ 1,552 1,504 131 —
Net income (loss) attributable to common stockholders ............... $7,638 $4,693 $(4,428) $109,118
Weighted-average shares outstanding — diluted
Weighted-average common shares outstanding — basic .............. 1,536 1,500 1,238 611
Dilutiveeffectofwarrants ..................................... 130 106 — —
Dilutive effect of conversion of Series B Preferred Stock . . . . . . . . . . . . . — 17 — —
Dilutive effect of restricted stock units (RSUs) ..................... 2 1 — —
Weighted-average common shares outstanding — diluted ............ 1,668 1,624 1,238 611
Diluted earnings (loss) per share ................................. $ 4.58 $ 2.89 $ (3.58) $ 178.55
(a) Includes earned but undeclared dividends of $26 million, $26 million and $34 million on our Series A Preferred Stock and $20
million, $25 million and $0 on our Series B Preferred Stock in the years ended December 31, 2011 and 2010 and in the period
July 10, 2009 through December 31, 2009.
(b) Includes cumulative dividends on preferred stock of $859 million and earnings of $746 million that have been allocated to the
Series B Preferred Stock holders in the year ended December 31, 2011; cumulative dividends on preferred stock of $827 million
and a charge related to the purchase of Series A Preferred Stock of $677 million in the year ended December 31, 2010; and
cumulative dividends on preferred stock of $131 million in the period July 10, 2009 through December 31, 2009, which excludes
dividends of $252 million which were paid to the New VEBA prior to December 31, 2009, as these shares were not considered
outstanding until December 31, 2009 due to the terms of the 2009 UAW Retiree Settlement Agreement. Payments made to the
New VEBA were recorded as employer contributions and included in Net income (loss) attributable to stockholders.
(c) Includes cumulative dividends on preferred stock of $859 million and earnings of $693 million that have been allocated to the
Series B Preferred Stock holders in the year ended December 31, 2011; cumulative dividends on preferred stock of $827 million
and a charge related to the purchase of Series A Preferred Stock of $677 million in the year ended December 31, 2010; and
cumulative dividends on preferred stock of $131 million in the period July 10, 2009 through December 31, 2009.
174 General Motors Company 2011 Annual Report