General Motors 2011 Annual Report Download - page 38
Download and view the complete annual report
Please find page 38 of the 2011 General Motors annual report below. You can navigate through the pages in the report by either clicking on the pages listed below, or by using the keyword search tool below to find specific information within the annual report.-
 1
1 -
2
-
3
-
4
-
5
-
6
-
7
-
8
-
9
-
10
-
11
-
12
-
13
-
14
-
15
-
16
-
17
-
18
-
19
-
20
-
21
-
22
-
23
-
24
-
25
-
26
-
27
-
 28
28 -
 29
29 -
 30
30 -
 31
31 -
 32
32 -
 33
33 -
 34
34 -
 35
35 -
 36
36 -
 37
37 -
 38
38 -
 39
39 -
 40
40 -
 41
41 -
 42
42 -
 43
43 -
 44
44 -
 45
45 -
 46
46 -
 47
47 -
 48
48 -
49
-
50
-
51
-
52
-
53
-
54
-
55
-
56
-
57
-
58
-
59
-
60
-
61
-
62
-
63
-
64
-
65
-
66
-
67
-
68
-
69
-
70
-
71
-
72
-
73
-
74
-
75
-
76
-
77
-
78
-
79
-
80
-
81
-
82
-
83
-
84
-
85
-
86
-
87
-
88
-
89
-
90
-
91
-
92
-
93
-
94
-
95
-
96
-
97
-
98
-
99
-
100
-
101
-
102
-
103
-
104
-
105
-
106
-
107
-
108
-
109
-
110
-
111
-
112
-
113
-
114
-
115
-
116
-
117
-
118
-
119
-
120
-
121
-
122
-
123
-
124
-
125
-
126
-
127
-
128
-
129
-
130
-
131
-
132
-
133
-
134
-
135
-
136
-
137
-
138
-
139
-
140
-
141
-
142
-
143
-
144
-
145
-
146
-
147
-
148
-
149
-
150
-
151
-
152
-
153
-
154
-
155
-
156
-
157
-
158
-
159
-
160
-
161
-
162
-
163
-
164
-
165
-
166
-
167
-
168
-
169
-
170
-
171
-
172
-
173
-
174
-
175
-
176
-
177
-
178
-
179
-
180
-
181
-
182
-
183
-
184
-
185
-
186
-
187
-
188
-
189
-
190
-
191
-
192
-
193
-
194
-
195
-
196
-
197
-
198
-
199
-
200
 |
 |

GENERAL MOTORS COMPANY AND SUBSIDIARIES
In the year ended December 31, 2010 EBIT-adjusted was a loss of $2.0 billion and included: (1) restructuring charges of $0.8
billion related to separation programs in Belgium, Spain, Germany and the United Kingdom; (2) advertising and sales promotion
expenses of $0.8 billion related to support media campaigns for our products; (3) administrative expense of $0.6 billion; and
(4) selling and marketing expenses of $0.5 billion related to our dealerships.
In the period July 10, 2009 through December 31, 2009 EBIT-adjusted was a loss of $0.8 billion and included: (1) advertising and
sales promotion expenses of $0.4 billion related to support media campaigns for our products; (2) administrative expense of $0.3
billion; (3) selling and marketing expenses of $0.3 billion related to our dealerships; partially offset by (4) favorable adjustments in
Automotive cost of sales of $0.5 billion due to the sell through of inventory acquired from Old GM at July 10, 2009.
Old GM
In the period January 1, 2009 through July 9, 2009 EBIT-adjusted was a loss of $2.8 billion and included: (1) charges of $0.8
billion related to the deconsolidation of Saab, which filed for reorganization protection under the laws of Sweden in February 2009;
(2) incremental depreciation charges of $0.7 billion related to restructuring activities; and (3) operating losses of $0.2 billion related to
Saab.
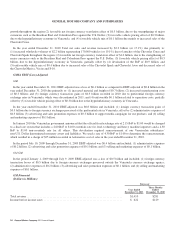
GM International Operations
(Dollars in Millions)
Successor
Combined GM
and Old GM Successor Predecessor
Year Ended
December 31,
2011
Year Ended
December 31,
2010
Year Ended
December 31,
2009
July 10, 2009
Through
December 31,
2009
January 1,
2009
Through
July 9, 2009
Year Ended
2011 vs. 2010
Change
Year Ended
2010 vs. 2009
Change
Amount % Amount %
Total net sales and
revenue ............ $24,761 $20,561 $14,345 $8,127 $6,218 $4,200 20.4% $6,216 43.3%
EBIT (loss)-adjusted . . . . $ 1,897 $ 2,262 $ 789 $ (486) $ (365) (16.1)%
GMIO Total Net Sales and Revenue
In the year ended December 31, 2011 Total net sales and revenue increased by $4.2 billion (or 20.4%) due primarily to:
(1) increased wholesale volume of $2.7 billion representing 113,000 vehicles due to strong industry growth across the region;
(2) favorable net foreign currency translation of $0.8 billion due to the strengthening of major currencies such as the Australian
Dollar, the Korean Won and the Euro against the U.S. Dollar; (3) favorable vehicle mix of $0.5 billion due to launches of the Alpheon
and Chevrolet Orlando; and (4) favorable vehicle pricing effect of $0.2 billion due to higher pricing on new models launched and
lower sales incentives.
In the year ended December 31, 2010 Total net sales and revenue increased by $6.2 billion (or 43.3%) due primarily to:
(1) increased wholesale volumes of $3.9 billion representing 118,000 vehicles (or 11.8%) due to the global economic recovery;
(2) favorable net foreign currency translation effect of $0.9 billion, due to the strengthening of the Korean Won, Australian Dollar and
South African Rand against the U.S. Dollar; (3) favorable vehicle mix of $0.8 billion due to the launch of the Chevrolet Cruze and
increased sales of sports utility vehicles; (4) derivative losses of $0.8 billion in the period January 1, 2009 through July 9, 2009, that
did not recur in 2010, due to the weakening of the Korean Won against the U.S. Dollar; and (5) favorable vehicle pricing effect of
$0.1 billion, due to higher pricing on new model launches at GM Korea. Subsequent to July 10, 2009, all gains and losses on
non-designated derivatives were recorded in Interest income and other non-operating income, net.
The vehicle sales related to our China and India (Our operations in India were deconsolidated effective February 2010) joint
ventures is not reflected in Total net sales and revenue. The results of our joint ventures are recorded in Equity income, net of tax and
gain on disposal of investments.
36 General Motors Company 2011 Annual Report