General Motors 2011 Annual Report Download - page 171
Download and view the complete annual report
Please find page 171 of the 2011 General Motors annual report below. You can navigate through the pages in the report by either clicking on the pages listed below, or by using the keyword search tool below to find specific information within the annual report.-
 1
1 -
2
-
3
-
4
-
5
-
6
-
7
-
8
-
9
-
10
-
11
-
12
-
13
-
14
-
15
-
16
-
17
-
18
-
19
-
20
-
21
-
22
-
23
-
24
-
25
-
26
-
27
-
28
-
29
-
30
-
31
-
32
-
33
-
34
-
35
-
36
-
37
-
38
-
39
-
40
-
41
-
42
-
43
-
44
-
45
-
46
-
47
-
48
-
49
-
50
-
51
-
52
-
53
-
54
-
55
-
56
-
57
-
58
-
59
-
60
-
61
-
62
-
63
-
64
-
65
-
66
-
67
-
68
-
69
-
70
-
71
-
72
-
73
-
74
-
75
-
76
-
77
-
78
-
79
-
80
-
81
-
82
-
83
-
84
-
85
-
86
-
87
-
88
-
89
-
90
-
91
-
92
-
93
-
94
-
95
-
96
-
97
-
98
-
99
-
100
-
101
-
102
-
103
-
104
-
105
-
106
-
107
-
108
-
109
-
110
-
111
-
112
-
113
-
114
-
115
-
116
-
117
-
118
-
119
-
120
-
121
-
122
-
123
-
124
-
125
-
126
-
127
-
128
-
129
-
130
-
131
-
132
-
133
-
134
-
135
-
136
-
137
-
138
-
139
-
140
-
141
-
142
-
143
-
144
-
145
-
146
-
147
-
148
-
149
-
150
-
151
-
152
-
153
-
154
-
155
-
156
-
157
-
158
-
159
-
160
-
 161
161 -
 162
162 -
 163
163 -
 164
164 -
 165
165 -
 166
166 -
 167
167 -
 168
168 -
 169
169 -
 170
170 -
 171
171 -
 172
172 -
 173
173 -
 174
174 -
 175
175 -
 176
176 -
 177
177 -
 178
178 -
 179
179 -
 180
180 -
 181
181 -
182
-
183
-
184
-
185
-
186
-
187
-
188
-
189
-
190
-
191
-
192
-
193
-
194
-
195
-
196
-
197
-
198
-
199
-
200
 |
 |

GENERAL MOTORS COMPANY AND SUBSIDIARIES
NOTES TO CONSOLIDATED FINANCIAL STATEMENTS — (Continued)
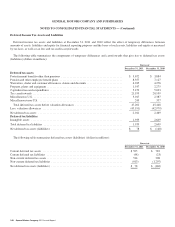
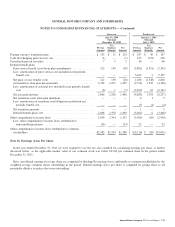
Note 24. Interest Income and Other Non-Operating Income, net
Automotive
The following table summarizes the components of Interest income and other non-operating income, net (dollars in millions):
Successor Predecessor
Year Ended
December 31, 2011
Year Ended
December 31, 2010
July 10, 2009
Through
December 31, 2009
January 1, 2009
Through
July 9, 2009
Interest income ................................... $455 $ 465 $ 184 $183
Net gains on derivatives . . . . . . . . . . . . . . . . . . . . . . . . . . . . 41 68 278 —
Rentalincome .................................... 149 164 88 100
Dividends and royalties . . . . . . . . . . . . . . . . . . . . . . . . . . . . . 153 213 105 145
Other(a)......................................... 53 621 (280) 424
Total interest income and other non-operating income,
net ........................................... $851 $1,531 $375 $852
(a) Amounts in the year ended December 31, 2011 include impairment charges related to the cost method investment in Ally
Financial of $555 million, a gain on the sale of Ally Financial preferred shares of $339 million, and recognition of deferred
income from technology agreements with SGMW of $113 million. Amounts in the year ended December 31, 2010 include a gain
on the reversal of an accrual for contingently issuable Adjustment Shares of $162 million, a gain on the sale of Saab of $123
million, a gain on the acquisition of GMS of $66 million and a gain on the sale of Nexteer of $60 million. Amounts in the period
July 10, 2009 through December 31, 2009 include impairment charges related to Ally Financial common stock of $270 million.
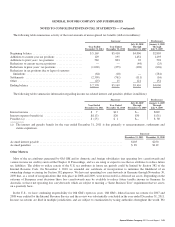
Note 25. Stockholders’ Equity and Noncontrolling Interests
Consolidated
Preferred Stock
The following table summarizes significant features relating to our preferred stock (dollars in millions, except for per share
amounts):
Successor
Dividends Paid
Liquidation
Preference
Per Share
Dividend
Rate
Per Annum
Year Ended
December 31, 2011
Year Ended
December 31, 2010
July 10, 2009
Through
December 31, 2009
Series A Preferred Stock ....................... $25.00 9.00% $621 $810 $349
Series B Preferred Stock ....................... $50.00 4.75% $243 $ —
Series A Preferred Stock
The Series A Preferred Stock ranks senior with respect to liquidation preference and dividend rights to our common stock and
Series B Preferred Stock and any other class or series of stock that we may issue. In the event of any voluntary or involuntary
liquidation, dissolution, or winding up of our affairs, a holder of Series A Preferred Stock will be entitled to be paid, before any
distribution or payment may be made to any holders of common stock or Series B Preferred Stock, the liquidation amount and the
amount of any accrued and unpaid dividends, if any, whether or not declared, prior to such distribution or payment date. On or after
December 31, 2014, the Series A Preferred Stock may be redeemed, in whole or in part, for cash at a price per share equal to the
$25.00 per share liquidation amount, plus any accrued and unpaid dividends. Upon a redemption or purchase of any or all Series A
General Motors Company 2011 Annual Report 169