General Motors 2011 Annual Report Download - page 105
Download and view the complete annual report
Please find page 105 of the 2011 General Motors annual report below. You can navigate through the pages in the report by either clicking on the pages listed below, or by using the keyword search tool below to find specific information within the annual report.-
 1
1 -
2
-
3
-
4
-
5
-
6
-
7
-
8
-
9
-
10
-
11
-
12
-
13
-
14
-
15
-
16
-
17
-
18
-
19
-
20
-
21
-
22
-
23
-
24
-
25
-
26
-
27
-
28
-
29
-
30
-
31
-
32
-
33
-
34
-
35
-
36
-
37
-
38
-
39
-
40
-
41
-
42
-
43
-
44
-
45
-
46
-
47
-
48
-
49
-
50
-
51
-
52
-
53
-
54
-
55
-
56
-
57
-
58
-
59
-
60
-
61
-
62
-
63
-
64
-
65
-
66
-
67
-
68
-
69
-
70
-
71
-
72
-
73
-
74
-
75
-
76
-
77
-
78
-
79
-
80
-
81
-
82
-
83
-
84
-
85
-
86
-
87
-
88
-
89
-
90
-
91
-
92
-
93
-
94
-
 95
95 -
 96
96 -
 97
97 -
 98
98 -
 99
99 -
 100
100 -
 101
101 -
 102
102 -
 103
103 -
 104
104 -
 105
105 -
 106
106 -
 107
107 -
 108
108 -
 109
109 -
 110
110 -
 111
111 -
 112
112 -
 113
113 -
 114
114 -
 115
115 -
116
-
117
-
118
-
119
-
120
-
121
-
122
-
123
-
124
-
125
-
126
-
127
-
128
-
129
-
130
-
131
-
132
-
133
-
134
-
135
-
136
-
137
-
138
-
139
-
140
-
141
-
142
-
143
-
144
-
145
-
146
-
147
-
148
-
149
-
150
-
151
-
152
-
153
-
154
-
155
-
156
-
157
-
158
-
159
-
160
-
161
-
162
-
163
-
164
-
165
-
166
-
167
-
168
-
169
-
170
-
171
-
172
-
173
-
174
-
175
-
176
-
177
-
178
-
179
-
180
-
181
-
182
-
183
-
184
-
185
-
186
-
187
-
188
-
189
-
190
-
191
-
192
-
193
-
194
-
195
-
196
-
197
-
198
-
199
-
200
 |
 |

GENERAL MOTORS COMPANY AND SUBSIDIARIES
NOTES TO CONSOLIDATED FINANCIAL STATEMENTS — (Continued)
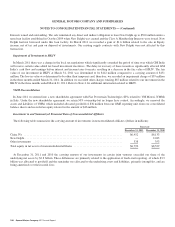
Successor
December 31, 2010
Unrealized Fair
Value
Fair Value Measurements on a Recurring Basis
Cost Gains Losses Level 1 Level 2 Level 3
Available-for-sale securities
U.S. government and agencies .............. $2,023 $— $— $2,023 $— $2,023 $—
Sovereign debt . . . . . . . . . . . . . . . . . . . . . . . . . . 773 — — 773 — 773 —
Certificates of deposit . . . . . . . . . . . . . . . . . . . . 954 — — 954 — 954 —
Corporate debt .......................... 1,670 1 2 1,669 — 1,669 —
Total available-for-sale securities ............. 5,420 1 2 5,419 — 5,419 —
Trading securities
Equity ................................. 34 5 1 38 21 17 —
Sovereigndebt .......................... 28 4 — 32 — 32 —
Otherdebt.............................. 67 1 2 66 — 66 —
Total trading securities . . . . . . . . . . . . . . . . . . . . . . 129 10 3 136 21 115 —
Total marketable securities .................. $5,549 $11 $ 5 $5,555 $21 $5,534 $—
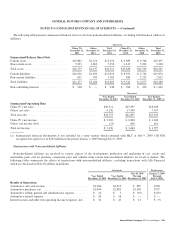
We maintained trading securities of $84 million and $89 million as compensating balances to support letters of credit of $70 million
and $74 million at December 31, 2011 and 2010. We have access to these securities in the normal course of business; however, the
letters of credit may be withdrawn if the minimum collateral balance is not maintained.
The following table summarizes sales proceeds from investments in marketable securities classified as available-for-sale and sold
prior to maturity (dollars in millions):
Successor Predecessor
Year Ended
December 31, 2011
Year Ended
December 31, 2010
July 10, 2009
Through
December 31, 2009
January 1, 2009
Through
July 9, 2009
Sales proceeds ...................................... $1,556 $11 $3 $185
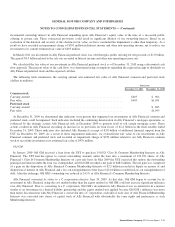
The following table summarizes the fair value of investments classified as available-for-sale securities by contractual maturity at
December 31, 2011 (dollars in millions):
Successor
Amortized
Cost
Fair
Value
Due in one year or less ....................................................................... $ 8,413 $ 8,414
Due after one year through five years ............................................................ 1,688 1,688
Total contractual maturities of available-for-sale securities ........................................... $10,101 $10,102
General Motors Company 2011 Annual Report 103