General Motors 2011 Annual Report Download - page 163
Download and view the complete annual report
Please find page 163 of the 2011 General Motors annual report below. You can navigate through the pages in the report by either clicking on the pages listed below, or by using the keyword search tool below to find specific information within the annual report.-
 1
1 -
2
-
3
-
4
-
5
-
6
-
7
-
8
-
9
-
10
-
11
-
12
-
13
-
14
-
15
-
16
-
17
-
18
-
19
-
20
-
21
-
22
-
23
-
24
-
25
-
26
-
27
-
28
-
29
-
30
-
31
-
32
-
33
-
34
-
35
-
36
-
37
-
38
-
39
-
40
-
41
-
42
-
43
-
44
-
45
-
46
-
47
-
48
-
49
-
50
-
51
-
52
-
53
-
54
-
55
-
56
-
57
-
58
-
59
-
60
-
61
-
62
-
63
-
64
-
65
-
66
-
67
-
68
-
69
-
70
-
71
-
72
-
73
-
74
-
75
-
76
-
77
-
78
-
79
-
80
-
81
-
82
-
83
-
84
-
85
-
86
-
87
-
88
-
89
-
90
-
91
-
92
-
93
-
94
-
95
-
96
-
97
-
98
-
99
-
100
-
101
-
102
-
103
-
104
-
105
-
106
-
107
-
108
-
109
-
110
-
111
-
112
-
113
-
114
-
115
-
116
-
117
-
118
-
119
-
120
-
121
-
122
-
123
-
124
-
125
-
126
-
127
-
128
-
129
-
130
-
131
-
132
-
133
-
134
-
135
-
136
-
137
-
138
-
139
-
140
-
141
-
142
-
143
-
144
-
145
-
146
-
147
-
148
-
149
-
150
-
151
-
152
-
 153
153 -
 154
154 -
 155
155 -
 156
156 -
 157
157 -
 158
158 -
 159
159 -
 160
160 -
 161
161 -
 162
162 -
 163
163 -
 164
164 -
 165
165 -
 166
166 -
 167
167 -
 168
168 -
 169
169 -
 170
170 -
 171
171 -
 172
172 -
 173
173 -
174
-
175
-
176
-
177
-
178
-
179
-
180
-
181
-
182
-
183
-
184
-
185
-
186
-
187
-
188
-
189
-
190
-
191
-
192
-
193
-
194
-
195
-
196
-
197
-
198
-
199
-
200
 |
 |

GENERAL MOTORS COMPANY AND SUBSIDIARIES
NOTES TO CONSOLIDATED FINANCIAL STATEMENTS — (Continued)
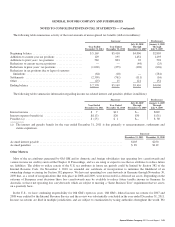
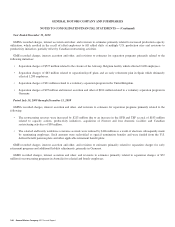
The following table summarizes the amount and expiration dates of our operating loss and tax credit carryforwards at December 31,
2011 (dollars in millions):
Successor
Expiration Dates Amounts
U.S. federal and state loss carryforwards ..................................................... 2012-2030 $11,220
Non-U.S. loss and tax credit carryforwards ................................................... Indefinite 1,058
Non-U.S. loss and tax credit carryforwards ................................................... 2012-2031 4,118
U.S. alternative minimum tax credit ......................................................... Indefinite 669
U.S. general business credits (a) ............................................................ 2017-2031 1,908
U.S. foreign tax credits ................................................................... 2012-2021 2,226
Total loss and tax credit carryforwards ...................................................... $21,199
(a) The general business credits are principally composed of research and experimentation credits.
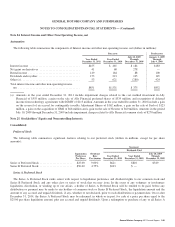
Valuation Allowances
The valuation allowances recognized relate to certain net deferred tax assets in U.S. and non-U.S. jurisdictions. The following table
summarizes the change in the valuation allowance (dollars in millions):
Successor Predecessor
Year Ended
December 31, 2011
Year Ended
December 31, 2010
July 10, 2009
Through
December 31, 2009
January 1, 2009
Through
July 9, 2009
Beginning balance ................................. $42,979 $45,281 $42,666 $ 59,777
Additions (Reversals)
U.S. ......................................... 2,411 (2,196) 2,226 (14,474)
Canada ........................................ (158) 63 405 (802)
Germany ...................................... 1 (139) 67 (792)
Spain ......................................... 463 378 (40) (200)
Brazil ......................................... (1) 1 1 (442)
SouthKorea .................................... 27 (121) (221) 321
Australia ...................................... (498) (39) 7 190
U.K. .......................................... 141 (121) 109 62
Sweden ....................................... 6 (58) 33 (1,057)
Other ......................................... (180) (70) 28 83
Ending balance ................................... $45,191 $42,979 $45,281 $ 42,666
In July 2009 Old GM recorded adjustments resulting in a net decrease in valuation allowances of $20.7 billion as a result of the 363
Sale and fresh-start reporting. The net decrease primarily resulted from U.S. federal and state tax attribute reduction of $12.2 billion
related to debt cancellation income, a net difference of $5.5 billion between fresh-start reporting and historical U.S. GAAP bases of
assets and liabilities at entities with valuation allowances, net valuation allowances of $1.7 billion associated with assets and liabilities
retained by MLC, a foreign tax attribute reduction of $0.9 billion and release of valuation allowances of $0.7 billion. In the year ended
December 31, 2011 we recorded an adjustment to the debt cancellation income that resulted from the 363 Sale. The adjustment
resulted in a $2.1 billion increase in valuation allowances related to U.S. Federal and state tax attributes.
General Motors Company 2011 Annual Report 161