General Motors 2011 Annual Report Download - page 79
Download and view the complete annual report
Please find page 79 of the 2011 General Motors annual report below. You can navigate through the pages in the report by either clicking on the pages listed below, or by using the keyword search tool below to find specific information within the annual report.-
 1
1 -
2
-
3
-
4
-
5
-
6
-
7
-
8
-
9
-
10
-
11
-
12
-
13
-
14
-
15
-
16
-
17
-
18
-
19
-
20
-
21
-
22
-
23
-
24
-
25
-
26
-
27
-
28
-
29
-
30
-
31
-
32
-
33
-
34
-
35
-
36
-
37
-
38
-
39
-
40
-
41
-
42
-
43
-
44
-
45
-
46
-
47
-
48
-
49
-
50
-
51
-
52
-
53
-
54
-
55
-
56
-
57
-
58
-
59
-
60
-
61
-
62
-
63
-
64
-
65
-
66
-
67
-
68
-
 69
69 -
 70
70 -
 71
71 -
 72
72 -
 73
73 -
 74
74 -
 75
75 -
 76
76 -
 77
77 -
 78
78 -
 79
79 -
 80
80 -
 81
81 -
 82
82 -
 83
83 -
 84
84 -
 85
85 -
 86
86 -
 87
87 -
 88
88 -
 89
89 -
90
-
91
-
92
-
93
-
94
-
95
-
96
-
97
-
98
-
99
-
100
-
101
-
102
-
103
-
104
-
105
-
106
-
107
-
108
-
109
-
110
-
111
-
112
-
113
-
114
-
115
-
116
-
117
-
118
-
119
-
120
-
121
-
122
-
123
-
124
-
125
-
126
-
127
-
128
-
129
-
130
-
131
-
132
-
133
-
134
-
135
-
136
-
137
-
138
-
139
-
140
-
141
-
142
-
143
-
144
-
145
-
146
-
147
-
148
-
149
-
150
-
151
-
152
-
153
-
154
-
155
-
156
-
157
-
158
-
159
-
160
-
161
-
162
-
163
-
164
-
165
-
166
-
167
-
168
-
169
-
170
-
171
-
172
-
173
-
174
-
175
-
176
-
177
-
178
-
179
-
180
-
181
-
182
-
183
-
184
-
185
-
186
-
187
-
188
-
189
-
190
-
191
-
192
-
193
-
194
-
195
-
196
-
197
-
198
-
199
-
200
 |
 |

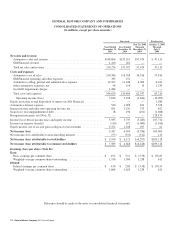
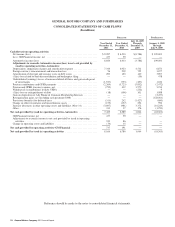
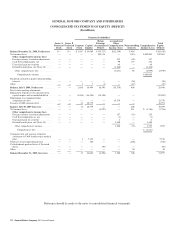
GENERAL MOTORS COMPANY AND SUBSIDIARIES
CONSOLIDATED STATEMENTS OF CASH FLOWS — (Continued)
(In millions)
Successor Predecessor
Year Ended
December 31,
2011
Year Ended
December 31,
2010
July 10, 2009
Through
December 31,
2009
January 1, 2009
Through
July 9, 2009
Cash flows from investing activities
Expenditures for property .............................................. (6,241) (4,200) (1,862) (3,517)
Available-for-sale marketable securities, acquisitions ........................ (20,535) (11,012) — (202)
Trading marketable securities, acquisitions ................................. (6,571) (358) (158) —
Available-for-sale marketable securities, liquidations ........................ 15,825 5,611 3 185
Trading marketable securities, liquidations . . . . . . . . . . . . . . . . . . . . . . . . . . . . . . . . . 660 343 168 —
Acquisition of companies, net of cash acquired other than cash acquired with GM
Financial .......................................................... (53) (3,580) (2,127) —
Increase due to consolidation of business units . . . . . . . . . . . . . . . . . . . . . . . . . . . . . . — 63 222 46
Distributions from (investments in) Ally Financial . . . . . . . . . . . . . . . . . . . . . . . . . . . — — 72 (884)
Operatingleases,liquidations ........................................... 9 346 564 1,307
Proceeds from sale of business units/investments, net ........................ 4,821 317 — —
Increase in restricted cash and marketable securities ......................... (543) (871) (3,604) (18,461)
Decrease in restricted cash and marketable securities ......................... 1,894 13,823 8,775 418
Otherinvestingactivities ............................................... 106 236 103 (26)
Net cash provided by (used in) investing activities–Automotive ................ (10,628) 718 2,156 (21,134)
GM Financial cash on hand at acquisition . . . . . . . . . . . . . . . . . . . . . . . . . . . . . . . . . . — 538 — —
Purchases of receivables ............................................... (5,012) (947) — —
Principal collections and recoveries on receivables .......................... 3,719 871 — —
Purchases of leased vehicles ............................................ (837) (11) — —
Otherinvestingactivities ............................................... 18 64 — —
Net cash provided by (used in) investing activities–GM Financial .............. (2,112) 515 — —
Net cash provided by (used in) investing activities ........................... (12,740) 1,233 2,156 (21,134)
Cash flows from financing activities
Net increase (decrease) in short-term debt . . . . . . . . . . . . . . . . . . . . . . . . . . . . . . . . . . 131 (1,097) (352) (2,364)
Proceeds from issuance of debt (original maturities greater than three months) . . . . 467 718 6,153 53,949
Payments on debt (original maturities greater than three months) ............... (1,471) (10,536) (5,259) (6,072)
Proceedsfromissuanceofstock ......................................... 11 4,857 — —
Payments to repurchase stock ........................................... — (1,462) — —
Cash, cash equivalents and restricted cash retained by MLC ................... — — — (1,216)
Payments to acquire noncontrolling interest ................................ (100) (6) (100) (5)
Debt issuance costs and fees paid for debt modification ....................... — (161) — (63)
Cash dividends paid (including premium paid on redemption of stock) .......... (916) (1,572) (97) —
Net cash provided by (used in) financing activities–Automotive ............... (1,878) (9,259) 345 44,229
Proceeds from issuance of debt (original maturities greater than three months) .... 8,567 1,168 — —
Payments on debt (original maturities greater than three months) ............... (6,997) (1,675) — —
Other financing activities ............................................... (50) (4) — —
Net cash provided by (used in) financing activities–GM Financial ............. 1,520 (511) — —
Net cash provided by (used in) financing activities .......................... (358) (9,770) 345 44,229
Effect of exchange rate changes on cash and cash equivalents–GM Financial . . . . (3) — — —
NettransactionswithAutomotive ........................................ 235 — — —
Net increase in cash and cash equivalents–GM Financial . . . . . . . . . . . . . . . . . . . . . . 377 195 — —
Cash and cash equivalents at beginning of period–GM Financial . . . . . . . . . . . . . . . . . 195 — — —
Cash and cash equivalents at end of period–GM Financial ................... $ 572 $ 195 $ — $ —
Effect of exchange rate changes on cash and cash equivalents–Automotive ...... $ (250) $ (57) $ 492 $ 168
Net transactions with GM Financial ...................................... (235) — — —
Net increase (decrease) in cash and cash equivalents–Automotive .............. (5,562) (2,009) 4,057 4,960
Cash and cash equivalents reclassified as assets held for sale–Automotive . . . . . . . . — 391 (391) —
Cash and cash equivalents at beginning of period–Automotive ................... 21,061 22,679 19,013 14,053
Cash and cash equivalents at end of period–Automotive ..................... $15,499 $ 21,061 $22,679 $ 19,013
Reference should be made to the notes to consolidated financial statements.
General Motors Company 2011 Annual Report 77