General Motors 2011 Annual Report Download - page 140
Download and view the complete annual report
Please find page 140 of the 2011 General Motors annual report below. You can navigate through the pages in the report by either clicking on the pages listed below, or by using the keyword search tool below to find specific information within the annual report.-
 1
1 -
2
-
3
-
4
-
5
-
6
-
7
-
8
-
9
-
10
-
11
-
12
-
13
-
14
-
15
-
16
-
17
-
18
-
19
-
20
-
21
-
22
-
23
-
24
-
25
-
26
-
27
-
28
-
29
-
30
-
31
-
32
-
33
-
34
-
35
-
36
-
37
-
38
-
39
-
40
-
41
-
42
-
43
-
44
-
45
-
46
-
47
-
48
-
49
-
50
-
51
-
52
-
53
-
54
-
55
-
56
-
57
-
58
-
59
-
60
-
61
-
62
-
63
-
64
-
65
-
66
-
67
-
68
-
69
-
70
-
71
-
72
-
73
-
74
-
75
-
76
-
77
-
78
-
79
-
80
-
81
-
82
-
83
-
84
-
85
-
86
-
87
-
88
-
89
-
90
-
91
-
92
-
93
-
94
-
95
-
96
-
97
-
98
-
99
-
100
-
101
-
102
-
103
-
104
-
105
-
106
-
107
-
108
-
109
-
110
-
111
-
112
-
113
-
114
-
115
-
116
-
117
-
118
-
119
-
120
-
121
-
122
-
123
-
124
-
125
-
126
-
127
-
128
-
129
-
 130
130 -
 131
131 -
 132
132 -
 133
133 -
 134
134 -
 135
135 -
 136
136 -
 137
137 -
 138
138 -
 139
139 -
 140
140 -
 141
141 -
 142
142 -
 143
143 -
 144
144 -
 145
145 -
 146
146 -
 147
147 -
 148
148 -
 149
149 -
 150
150 -
151
-
152
-
153
-
154
-
155
-
156
-
157
-
158
-
159
-
160
-
161
-
162
-
163
-
164
-
165
-
166
-
167
-
168
-
169
-
170
-
171
-
172
-
173
-
174
-
175
-
176
-
177
-
178
-
179
-
180
-
181
-
182
-
183
-
184
-
185
-
186
-
187
-
188
-
189
-
190
-
191
-
192
-
193
-
194
-
195
-
196
-
197
-
198
-
199
-
200
 |
 |

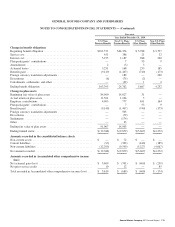
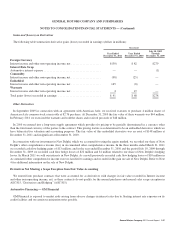
GENERAL MOTORS COMPANY AND SUBSIDIARIES
NOTES TO CONSOLIDATED FINANCIAL STATEMENTS — (Continued)
Fair Value Measurements of U.S. Plan Assets
at December 31, 2010
Fair Value Measurements of Non-U.S.
Plan Assets at December 31, 2010
Level 1 Level 2 Level 3
Total U.S.
Plan Assets Level 1 Level 2 Level 3
Total
Non-U.S.
Plan Assets
Total U.S.
and Non-
U.S. Plan
Assets
Assets
Cash equivalents and other short-term
investments ................... $ — $ 6,855 $ — $ 6,855 $ — $ 717 $ — $ 717 $ 7,572
Common and preferred stocks ....... 6,755 788 64 7,607 2,781 13 — 2,794 10,401
Government and agency debt
securities (b) .................. — 5,402 75 5,477 — 3,410 4 3,414 8,891
Corporate debt securities (c) ........ — 8,252 562 8,814 — 1,964 41 2,005 10,819
Agency mortgage and asset-backed
securities . . . . . . . . . . . . . . . . . . . . . — 476 — 476 — 44 — 44 520
Non-agency mortgage and asset-
backed securities ............... — 1,863 821 2,684 — 86 — 86 2,770
Group annuity contracts ........... — — 3,115 3,115 — — — — 3,115
Investment funds
Equity funds . . . . . . . . . . . . . . . . . . . 20 12,831 382 13,233 2 2,001 200 2,203 15,436
Fixed income funds . . . . . . . . . . . . . 48 9,882 2,287 12,217 — 1,085 — 1,085 13,302
Funds of hedge funds . . . . . . . . . . . . — 516 6,344 6,860 — — 74 74 6,934
Global macro funds . . . . . . . . . . . . . — 111 4 115 — — 255 255 370
Multi-strategy funds ............ — 4,624 3,546 8,170 — 34 — 34 8,204
Other investment funds (d) . . . . . . . — 150 186 336 — — 103 103 439
Private equity and debt
investments (e) ................ — — 8,037 8,037 — — 169 169 8,206
Real estate investments (f) ......... 1,648 1 5,508 7,157 11 39 1,263 1,313 8,470
Other investments . . . . . . . . . . . . . . . . — — — — — 104 281 385 385
Derivatives
Interest rate contracts ............ — 1,251 — 1,251 — — — — 1,251
Foreign currency exchange
contracts . . . . . . . . . . . . . . . . . . . . — 91 1 92 — 56 — 56 148
Equity contracts . . . . . . . . . . . . . . . . 73 3 20 96 — 19 — 19 115
Credit contracts . . . . . . . . . . . . . . . . — 62 3 65 — — — — 65
Total assets ..................... 8,544 53,158 30,955 92,657 2,794 9,572 2,390 14,756 107,413
Liabilities
Common and preferred stocks (g) .... (1,287) (121) — (1,408) — — — — (1,408)
Corporate debt securities (g) . . . . . . . . — — (2) (2) — — — — (2)
Real estate investments (g) ......... (41) — — (41) — — — — (41)
Derivatives
Interest rate contracts . . . . . . . . . . . . (4) (2,272) (18) (2,294) — — — — (2,294)
Foreign currency exchange
contracts .................... — (146) — (146) — (45) — (45) (191)
Equity contracts ................ (180) (2) (61) (243) — (7) — (7) (250)
Credit contracts ................ — (21) (4) (25) — — — — (25)
Total liabilities ................... (1,512) (2,562) (85) (4,159) — (52) — (52) (4,211)
Net plan assets subject to leveling .... $7,032 $50,596 $30,870 88,498 $2,794 $9,520 $2,390 14,704 103,202
Other plan assets and liabilities (h) . . . 2,509 199 2,708
Net Plan Assets .................. $91,007 $14,903 $105,910
(a) Includes GM common stock of $1.2 billion within Level 1 of U.S. plan assets.
138 General Motors Company 2011 Annual Report