General Motors 2011 Annual Report Download - page 102
Download and view the complete annual report
Please find page 102 of the 2011 General Motors annual report below. You can navigate through the pages in the report by either clicking on the pages listed below, or by using the keyword search tool below to find specific information within the annual report.-
 1
1 -
2
-
3
-
4
-
5
-
6
-
7
-
8
-
9
-
10
-
11
-
12
-
13
-
14
-
15
-
16
-
17
-
18
-
19
-
20
-
21
-
22
-
23
-
24
-
25
-
26
-
27
-
28
-
29
-
30
-
31
-
32
-
33
-
34
-
35
-
36
-
37
-
38
-
39
-
40
-
41
-
42
-
43
-
44
-
45
-
46
-
47
-
48
-
49
-
50
-
51
-
52
-
53
-
54
-
55
-
56
-
57
-
58
-
59
-
60
-
61
-
62
-
63
-
64
-
65
-
66
-
67
-
68
-
69
-
70
-
71
-
72
-
73
-
74
-
75
-
76
-
77
-
78
-
79
-
80
-
81
-
82
-
83
-
84
-
85
-
86
-
87
-
88
-
89
-
90
-
91
-
 92
92 -
 93
93 -
 94
94 -
 95
95 -
 96
96 -
 97
97 -
 98
98 -
 99
99 -
 100
100 -
 101
101 -
 102
102 -
 103
103 -
 104
104 -
 105
105 -
 106
106 -
 107
107 -
 108
108 -
 109
109 -
 110
110 -
 111
111 -
 112
112 -
113
-
114
-
115
-
116
-
117
-
118
-
119
-
120
-
121
-
122
-
123
-
124
-
125
-
126
-
127
-
128
-
129
-
130
-
131
-
132
-
133
-
134
-
135
-
136
-
137
-
138
-
139
-
140
-
141
-
142
-
143
-
144
-
145
-
146
-
147
-
148
-
149
-
150
-
151
-
152
-
153
-
154
-
155
-
156
-
157
-
158
-
159
-
160
-
161
-
162
-
163
-
164
-
165
-
166
-
167
-
168
-
169
-
170
-
171
-
172
-
173
-
174
-
175
-
176
-
177
-
178
-
179
-
180
-
181
-
182
-
183
-
184
-
185
-
186
-
187
-
188
-
189
-
190
-
191
-
192
-
193
-
194
-
195
-
196
-
197
-
198
-
199
-
200
 |
 |

GENERAL MOTORS COMPANY AND SUBSIDIARIES
NOTES TO CONSOLIDATED FINANCIAL STATEMENTS — (Continued)
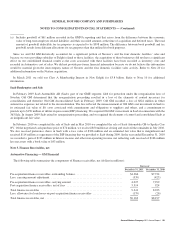
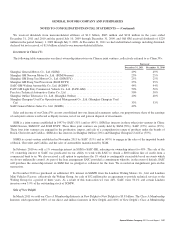
The following table summarizes activity for finance receivables (dollars in millions):
Successor
Year Ended
December 31, 2011
October 1, 2010
Through
December 31, 2010
Pre-acquisition finance receivables, carrying amount, beginning of period ................... $7,299 $8,231
Post-acquisition finance receivables, beginning of period . . . . . . . . . . . . . . . . . . . . . . . . . . . . . . . . 924 —
Loans purchased ................................................................ 5,085 935
Charge-offs .................................................................... (66) —
Principal collections and other ..................................................... (3,418) (765)
Change in carrying amount adjustment on the pre-acquisition finance receivables ............. (483) (178)
Balance at end of period .......................................................... $9,341 $8,223
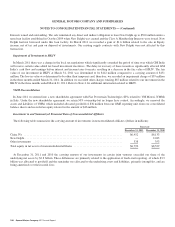
The following table summarizes the estimated fair value, carrying amount and various methods and assumptions used in valuing
GM Financial’s finance receivables (dollars in millions):
Successor
December 31, 2011 December 31, 2010
Carrying
Amount
Estimated
Fair Value
Carrying
Amount
Estimated
Fair Value
Finance receivables, net (a) .................................................. $9,162 $9,386 $8,197 $8,186
(a) The fair value is estimated based upon forecasted cash flows discounted using a pre-tax weighted-average cost of capital
(WACC). The forecast includes factors such as prepayment, defaults, recoveries and fee income assumptions.
Finance contracts are purchased by GM Financial from automobile dealers without recourse, and accordingly, the dealer has no
liability to GM Financial if the consumer defaults on the contract. Finance receivables are collateralized by vehicle titles and GM
Financial has the right to repossess the vehicle in the event the consumer defaults on the payment terms of the contract.
At December 31, 2011 and 2010 the accrual of finance charge income has been suspended on delinquent finance receivables based
on contractual amounts due of $439 million and $491 million.
GM Financial reviews its pre-acquisition portfolio for differences between contractual cash flows and the cash flows expected to be
collected from its initial investment in the pre-acquisition portfolio to determine if the difference is attributable, at least, in part to
credit quality. At December 31, 2011 as a result of improvements in the credit performance of the pre-acquisition portfolio, which
resulted in an increase of expected cash flows of $261 million, GM Financial transferred the excess non-accretable discount to
accretable yield. GM Financial will recognize this excess as finance charge income over the remaining life of the portfolio.
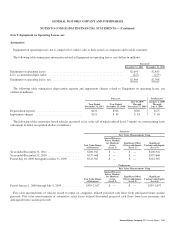
The following table summarizes accretable yield (dollars in millions):
Successor
Year Ended
December 31, 2011
October 1, 2010
Through
December 31, 2010
Balance at beginning of period ..................................................... $1,201 $1,436
Accretion of accretable yield ...................................................... (725) (235)
Transferfromnon-accretablediscount ............................................... 261 —
Balanceatendofperiod .......................................................... $ 737 $1,201
100 General Motors Company 2011 Annual Report