General Motors 2011 Annual Report Download - page 190
Download and view the complete annual report
Please find page 190 of the 2011 General Motors annual report below. You can navigate through the pages in the report by either clicking on the pages listed below, or by using the keyword search tool below to find specific information within the annual report.-
 1
1 -
2
-
3
-
4
-
5
-
6
-
7
-
8
-
9
-
10
-
11
-
12
-
13
-
14
-
15
-
16
-
17
-
18
-
19
-
20
-
21
-
22
-
23
-
24
-
25
-
26
-
27
-
28
-
29
-
30
-
31
-
32
-
33
-
34
-
35
-
36
-
37
-
38
-
39
-
40
-
41
-
42
-
43
-
44
-
45
-
46
-
47
-
48
-
49
-
50
-
51
-
52
-
53
-
54
-
55
-
56
-
57
-
58
-
59
-
60
-
61
-
62
-
63
-
64
-
65
-
66
-
67
-
68
-
69
-
70
-
71
-
72
-
73
-
74
-
75
-
76
-
77
-
78
-
79
-
80
-
81
-
82
-
83
-
84
-
85
-
86
-
87
-
88
-
89
-
90
-
91
-
92
-
93
-
94
-
95
-
96
-
97
-
98
-
99
-
100
-
101
-
102
-
103
-
104
-
105
-
106
-
107
-
108
-
109
-
110
-
111
-
112
-
113
-
114
-
115
-
116
-
117
-
118
-
119
-
120
-
121
-
122
-
123
-
124
-
125
-
126
-
127
-
128
-
129
-
130
-
131
-
132
-
133
-
134
-
135
-
136
-
137
-
138
-
139
-
140
-
141
-
142
-
143
-
144
-
145
-
146
-
147
-
148
-
149
-
150
-
151
-
152
-
153
-
154
-
155
-
156
-
157
-
158
-
159
-
160
-
161
-
162
-
163
-
164
-
165
-
166
-
167
-
168
-
169
-
170
-
171
-
172
-
173
-
174
-
175
-
176
-
177
-
178
-
179
-
 180
180 -
 181
181 -
 182
182 -
 183
183 -
 184
184 -
 185
185 -
 186
186 -
 187
187 -
 188
188 -
 189
189 -
 190
190 -
 191
191 -
 192
192 -
 193
193 -
 194
194 -
 195
195 -
 196
196 -
 197
197 -
 198
198 -
 199
199 -
 200
200
 |
 |

GENERAL MOTORS COMPANY AND SUBSIDIARIES
NOTES TO CONSOLIDATED FINANCIAL STATEMENTS — (Continued)
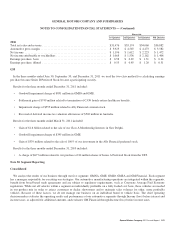
Note 31. Supplemental Information for Consolidated Statements of Cash Flows
The following table summarizes the sources (uses) of cash provided by Automotive Increase (decrease) in other operating assets
and liabilities and cash paid for income taxes and interest (dollars in millions):
Successor Predecessor
Year Ended
December 31, 2011
Year Ended
December 31, 2010
July 10, 2009
Through
December 31, 2009
January 1, 2009
Through
July 9, 2009
Accounts receivable ................................ $(1,572) $ (641) $ 660 $ (268)
Prepaid expenses and other deferred charges ............ (195) 299 315 1,416
Inventories ....................................... (2,760) (2,229) (315) 3,509
Accounts payable .................................. 2,095 2,259 5,363 (8,846)
Income taxes payable .............................. (289) 51 401 606
Accrued liabilities and other liabilities ................. (654) (92) (3,225) (6,815)
Equipment on operating leases ....................... (522) (628) 173 169
Total ............................................ $(3,897) $ (981) $ 3,372 $(10,229)
Cash paid for income taxes and interest
Cash paid (received) for income taxes . . . . . . . . . . . . . . . . . $ 569 $ 357 $ (65) $ (1,011)
Cash paid for interest — Automotive . . . . . . . . . . . . . . . . . . $ 317 $ 1,001 $ 618 $ 2,513
Cash paid for interest — GM Financial . . . . . . . . . . . . . . . . 284 66
Total cash paid for interest . . . . . . . . . . . . . . . . . . . . . . . . . . $ 601 $ 1,067
Significant Non-Cash Activity
Investing Cash Flows
The following table summarizes the amounts of unpaid property acquisitions that have been excluded from Expenditures for
property within the investing activities section of the consolidated statement of cash flows because no cash has been expended (dollars
in millions):
Successor Predecessor
Year Ended
December 31, 2011
Year Ended
December 31, 2010
July 10, 2009
Through
December 31, 2009
January 1, 2009
Through
July 9, 2009
Accrued expenditures for property .................... $3,689 $2,290 $1,710 $2,124
Financing Cash Flows
The following table summarizes the amounts relating to non-cash financing activities that have been excluded from the financing
activities section of the consolidated statements of cash flows because no cash has been received (dollars in millions):
Successor Predecessor
Year Ended
December 31, 2011
Year Ended
December 31, 2010
July 10, 2009
Through
December 31, 2009
January 1, 2009
Through
July 9, 2009
Common stock contributed to U.S. hourly and salaried
pension plans ................................... $1,864 $— $ — $—
Notes issued to settle CAW hourly retiree healthcare
plan .......................................... $1,122 $— $ — $—
UAW hourly retiree medical plan:
Common stock and warrants contributed to VEBA . . . . . $ — $— $5,156 $—
Notes contributed to VEBA . . . . . . . . . . . . . . . . . . . . . . . . $ — $— $2,825 $—
Series A Preferred Stock contributed to VEBA . . . . . . . . $ — $— $5,257 $—
188 General Motors Company 2011 Annual Report