General Motors 2011 Annual Report Download - page 149
Download and view the complete annual report
Please find page 149 of the 2011 General Motors annual report below. You can navigate through the pages in the report by either clicking on the pages listed below, or by using the keyword search tool below to find specific information within the annual report.-
 1
1 -
2
-
3
-
4
-
5
-
6
-
7
-
8
-
9
-
10
-
11
-
12
-
13
-
14
-
15
-
16
-
17
-
18
-
19
-
20
-
21
-
22
-
23
-
24
-
25
-
26
-
27
-
28
-
29
-
30
-
31
-
32
-
33
-
34
-
35
-
36
-
37
-
38
-
39
-
40
-
41
-
42
-
43
-
44
-
45
-
46
-
47
-
48
-
49
-
50
-
51
-
52
-
53
-
54
-
55
-
56
-
57
-
58
-
59
-
60
-
61
-
62
-
63
-
64
-
65
-
66
-
67
-
68
-
69
-
70
-
71
-
72
-
73
-
74
-
75
-
76
-
77
-
78
-
79
-
80
-
81
-
82
-
83
-
84
-
85
-
86
-
87
-
88
-
89
-
90
-
91
-
92
-
93
-
94
-
95
-
96
-
97
-
98
-
99
-
100
-
101
-
102
-
103
-
104
-
105
-
106
-
107
-
108
-
109
-
110
-
111
-
112
-
113
-
114
-
115
-
116
-
117
-
118
-
119
-
120
-
121
-
122
-
123
-
124
-
125
-
126
-
127
-
128
-
129
-
130
-
131
-
132
-
133
-
134
-
135
-
136
-
137
-
138
-
 139
139 -
 140
140 -
 141
141 -
 142
142 -
 143
143 -
 144
144 -
 145
145 -
 146
146 -
 147
147 -
 148
148 -
 149
149 -
 150
150 -
 151
151 -
 152
152 -
 153
153 -
 154
154 -
 155
155 -
 156
156 -
 157
157 -
 158
158 -
 159
159 -
160
-
161
-
162
-
163
-
164
-
165
-
166
-
167
-
168
-
169
-
170
-
171
-
172
-
173
-
174
-
175
-
176
-
177
-
178
-
179
-
180
-
181
-
182
-
183
-
184
-
185
-
186
-
187
-
188
-
189
-
190
-
191
-
192
-
193
-
194
-
195
-
196
-
197
-
198
-
199
-
200
 |
 |

GENERAL MOTORS COMPANY AND SUBSIDIARIES
NOTES TO CONSOLIDATED FINANCIAL STATEMENTS — (Continued)
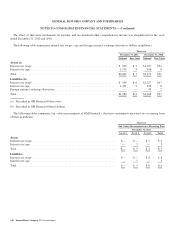
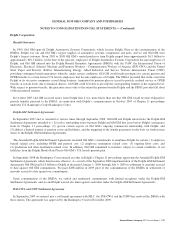
Gains and (Losses) on Derivatives
The following table summarizes derivative gains (losses) recorded in earnings (dollars in millions):
Successor
Year Ended
December 31, 2011
Year Ended
December 31, 2010
July 10, 2009
Through
December 31, 2009
Foreign Currency
Interest income and other non-operating income, net ..................... $(30) $ 82 $279
Interest Rate Swap
Automotiveinterestexpense ........................................ — — (1)
Commodity
Interest income and other non-operating income, net ..................... (98) (25) —
Embedded
Interest income and other non-operating income, net . . . . . . . . . . . . . . . . . . . . . 165 (8) —
Warrants
Interest income and other non-operating income, net . . . . . . . . . . . . . . . . . . . . . 4 19 —
Total gains (losses) recorded in earnings . . . . . . . . . . . . . . . . . . . . . . . . . . . . . . $ 41 $ 68 $278
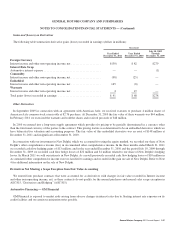
Other Derivatives
In September 2009 in connection with an agreement with American Axle, we received warrants to purchase 4 million shares of
American Axle common stock exercisable at $2.76 per share. At December 31, 2010 the fair value of these warrants was $44 million.
In February 2011 we exercised the warrants and sold the shares and received proceeds of $48 million.
In 2010 we entered into a long-term supply agreement which provides for pricing to be partially denominated in a currency other
than the functional currency of the parties to the contract. This pricing feature was determined to be an embedded derivative which we
have bifurcated for valuation and accounting purposes. The fair value of this embedded derivative was an asset of $148 million at
December 31, 2011 and insignificant at December 31, 2010.
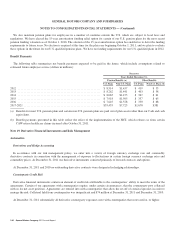
In connection with our investment in New Delphi, which we accounted for using the equity method, we recorded our share of New
Delphi’s other comprehensive income (loss) in Accumulated other comprehensive income. In the three months ended March 31, 2011
we recorded cash flow hedging gains of $13 million; and in the year ended December 31, 2010 and the period July 10, 2009 through
December 31, 2009 we recorded cash flow hedge losses of $22 million and $1 million related to our share of New Delphi’s hedging
losses. In March 2011 we sold our interests in New Delphi. As a result previously recorded cash flow hedging losses of $10 million in
Accumulated other comprehensive income were reclassified to earnings and recorded in the gain on sale of New Delphi. Refer to Note
4 for additional information on the sale of New Delphi.
Derivatives Not Meeting a Scope Exception from Fair Value Accounting
We entered into purchase contracts that were accounted for as derivatives with changes in fair value recorded in Interest income
and other non-operating income, net, as these contracts do not qualify for the normal purchases and normal sales scope exception in
ASC 815, “Derivatives and Hedging” (ASC 815).
Automotive Financing — GM Financial
GM Financial is exposed to market risks arising from adverse changes in interest rates due to floating interest rate exposure on its
credit facilities and on certain securitization notes payable.
General Motors Company 2011 Annual Report 147