General Motors 2011 Annual Report Download - page 174
Download and view the complete annual report
Please find page 174 of the 2011 General Motors annual report below. You can navigate through the pages in the report by either clicking on the pages listed below, or by using the keyword search tool below to find specific information within the annual report.-
 1
1 -
2
-
3
-
4
-
5
-
6
-
7
-
8
-
9
-
10
-
11
-
12
-
13
-
14
-
15
-
16
-
17
-
18
-
19
-
20
-
21
-
22
-
23
-
24
-
25
-
26
-
27
-
28
-
29
-
30
-
31
-
32
-
33
-
34
-
35
-
36
-
37
-
38
-
39
-
40
-
41
-
42
-
43
-
44
-
45
-
46
-
47
-
48
-
49
-
50
-
51
-
52
-
53
-
54
-
55
-
56
-
57
-
58
-
59
-
60
-
61
-
62
-
63
-
64
-
65
-
66
-
67
-
68
-
69
-
70
-
71
-
72
-
73
-
74
-
75
-
76
-
77
-
78
-
79
-
80
-
81
-
82
-
83
-
84
-
85
-
86
-
87
-
88
-
89
-
90
-
91
-
92
-
93
-
94
-
95
-
96
-
97
-
98
-
99
-
100
-
101
-
102
-
103
-
104
-
105
-
106
-
107
-
108
-
109
-
110
-
111
-
112
-
113
-
114
-
115
-
116
-
117
-
118
-
119
-
120
-
121
-
122
-
123
-
124
-
125
-
126
-
127
-
128
-
129
-
130
-
131
-
132
-
133
-
134
-
135
-
136
-
137
-
138
-
139
-
140
-
141
-
142
-
143
-
144
-
145
-
146
-
147
-
148
-
149
-
150
-
151
-
152
-
153
-
154
-
155
-
156
-
157
-
158
-
159
-
160
-
161
-
162
-
163
-
 164
164 -
 165
165 -
 166
166 -
 167
167 -
 168
168 -
 169
169 -
 170
170 -
 171
171 -
 172
172 -
 173
173 -
 174
174 -
 175
175 -
 176
176 -
 177
177 -
 178
178 -
 179
179 -
 180
180 -
 181
181 -
 182
182 -
 183
183 -
 184
184 -
185
-
186
-
187
-
188
-
189
-
190
-
191
-
192
-
193
-
194
-
195
-
196
-
197
-
198
-
199
-
200
 |
 |

GENERAL MOTORS COMPANY AND SUBSIDIARIES
NOTES TO CONSOLIDATED FINANCIAL STATEMENTS — (Continued)
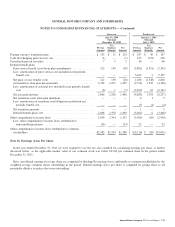
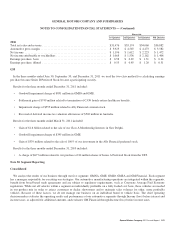
Accumulated Other Comprehensive Income (Loss)
The following table summarizes the components of Accumulated other comprehensive income (loss), net of taxes (dollars in
millions):
Successor
December 31,
2011
December 31,
2010
December 31,
2009
Foreigncurrencytranslationgain ............................................... $ 215 $ 394 $ 157
Cash flow hedging gains (losses), net ............................................ 2 (23) (1)
Net unrealized gain (loss) on securities . . . . . . . . . . . . . . . . . . . . . . . . . . . . . . . . . . . . . . . . . . (4) (5) 2
Defined benefit plans, net ..................................................... (6,074) 885 1,430
Accumulated other comprehensive income (loss) .................................. $(5,861) $1,251 $1,588
Other Comprehensive Income (Loss)
The following tables summarize the components of Other comprehensive income (loss) attributable to common stockholders
(dollars in millions):
Successor
Year Ended December 31, 2011 Year Ended December 31, 2010
Pre-tax
Amount
Tax Expense
(Benefit)
Net
Amount
Pre-tax
Amount
Tax Expense
(Benefit)
Net
Amount
Foreign currency translation gain (loss) ....................... $ (186) $ — $ (186) $ 210 $— $ 210
Cash flow hedging gain (losses), net . . . . . . . . . . . . . . . . . . . . . . . . . 15 — 15 (22) — (22)
Unrealized gain (loss) on securities . . . . . . . . . . . . . . . . . . . . . . . . . . 1 — 1 (7) — (7)
Defined benefit plans
Prior service benefit from plan amendments . . . . . . . . . . . . . . . . . 302 1 301 7 1 6
Less: amortization of prior service cost included in net periodic
benefit cost ......................................... (52) — (52) (12) — (12)
Net prior service benefit (cost) . . . . . . . . . . . . . . . . . . . . . . . . . . . . 250 1 249 (5) 1 (6)
Actuarial gain (loss) from plan measurements ................ (7,578) (10) (7,568) (530) 34 (564)
Less: amortization of actuarial loss included in net periodic
benefitcost(a) ...................................... 421 5 416 25 — 25
Net actuarial amounts ................................... (7,157) (5) (7,152) (505) 34 (539)
Defined benefit plans, net ................................ (6,907) (4) (6,903) (510) 35 (545)
Sale of interest in nonconsolidated affiliate .................... (42) — (42) — — —
Other comprehensive income (loss) .......................... (7,119) (4) (7,115) (329) 35 (364)
Less: other comprehensive loss attributable to noncontrolling
interests ............................................ (10) — (10) (13) — (13)
Other comprehensive income (loss) attributable to common
stockholders .......................................... $(7,109) $ (4) $(7,105) $(316) $35 $(351)
(a) Includes the Canadian healthcare trust settlement. Refer to Note 18.
172 General Motors Company 2011 Annual Report