General Motors 2011 Annual Report Download - page 182
Download and view the complete annual report
Please find page 182 of the 2011 General Motors annual report below. You can navigate through the pages in the report by either clicking on the pages listed below, or by using the keyword search tool below to find specific information within the annual report.-
 1
1 -
2
-
3
-
4
-
5
-
6
-
7
-
8
-
9
-
10
-
11
-
12
-
13
-
14
-
15
-
16
-
17
-
18
-
19
-
20
-
21
-
22
-
23
-
24
-
25
-
26
-
27
-
28
-
29
-
30
-
31
-
32
-
33
-
34
-
35
-
36
-
37
-
38
-
39
-
40
-
41
-
42
-
43
-
44
-
45
-
46
-
47
-
48
-
49
-
50
-
51
-
52
-
53
-
54
-
55
-
56
-
57
-
58
-
59
-
60
-
61
-
62
-
63
-
64
-
65
-
66
-
67
-
68
-
69
-
70
-
71
-
72
-
73
-
74
-
75
-
76
-
77
-
78
-
79
-
80
-
81
-
82
-
83
-
84
-
85
-
86
-
87
-
88
-
89
-
90
-
91
-
92
-
93
-
94
-
95
-
96
-
97
-
98
-
99
-
100
-
101
-
102
-
103
-
104
-
105
-
106
-
107
-
108
-
109
-
110
-
111
-
112
-
113
-
114
-
115
-
116
-
117
-
118
-
119
-
120
-
121
-
122
-
123
-
124
-
125
-
126
-
127
-
128
-
129
-
130
-
131
-
132
-
133
-
134
-
135
-
136
-
137
-
138
-
139
-
140
-
141
-
142
-
143
-
144
-
145
-
146
-
147
-
148
-
149
-
150
-
151
-
152
-
153
-
154
-
155
-
156
-
157
-
158
-
159
-
160
-
161
-
162
-
163
-
164
-
165
-
166
-
167
-
168
-
169
-
170
-
171
-
 172
172 -
 173
173 -
 174
174 -
 175
175 -
 176
176 -
 177
177 -
 178
178 -
 179
179 -
 180
180 -
 181
181 -
 182
182 -
 183
183 -
 184
184 -
 185
185 -
 186
186 -
 187
187 -
 188
188 -
 189
189 -
 190
190 -
 191
191 -
 192
192 -
193
-
194
-
195
-
196
-
197
-
198
-
199
-
200
 |
 |

GENERAL MOTORS COMPANY AND SUBSIDIARIES
NOTES TO CONSOLIDATED FINANCIAL STATEMENTS — (Continued)
(a) Represents wholesale settlements due from Ally Financial and receivables for exclusivity fees and royalties.
(b) Represents distributions due from Ally Financial on our investments in Ally Financial preferred stock.
(c) Represents amounts billed to us and payable related to incentive programs.
(d) Represents wholesale financing, sales of receivable transactions and the short-term portion of term loans provided to certain
dealerships which we own or in which we have an equity interest.
(e) Represents accruals for marketing incentives on vehicles which are sold, or anticipated to be sold, to customers or dealers and
financed by Ally Financial in North America. This includes the estimated amount of residual and rate support accrued,
capitalized cost reduction incentives and amounts owed under lease pull-ahead programs.
(f) Represents the long-term portion of term loans from Ally Financial to certain consolidated dealerships.
(g) Represents long-term portion of liabilities for marketing incentives on vehicles financed by Ally Financial.
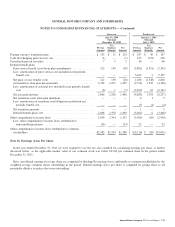
Statement of Operations
The following table summarizes the income statement effects of transactions with Ally Financial (dollars in millions):
Successor Predecessor
Year Ended
December 31,
2011
Year Ended
December 31,
2010
July 10, 2009
Through
December 31, 2009
January 1, 2009
Through
July 9, 2009
Total net sales and revenue (decrease) (a) ...................... $(1,468) $(1,383) $(259) $207
Automotive cost of sales and other automotive expenses (b) . . . . . . . $ 16 $ 36 $ 113 $180
Interest income and other non-operating income, net (c) . . . . . . . . . . $ 126 $ 228 $ 127 $166
Automotive interest expense (d) . . . . . . . . . . . . . . . . . . . . . . . . . . . . . $ 63 $ 243 $ 121 $100
(a) Represents marketing incentives on vehicles which were sold, or anticipated to be sold, to customers or dealers and financed by
Ally Financial. This includes the estimated amount of residual and rate support accrued, capitalized cost reduction incentives and
costs under lease pull-ahead programs. This amount is offset by net sales for vehicles sold to Ally Financial for employee and
governmental lease programs and third party resale purposes.
(b) Represents cost of sales on the sale of vehicles to Ally Financial for employee and governmental lease programs and third party
resale purposes.
(c) Represents income on investments in Ally Financial preferred stock (through March 31, 2011), exclusivity and royalty fee
income. Included in this amount is rental income related to Ally Financial’s primary executive and administrative offices located
in the Renaissance Center in Detroit, Michigan. The lease agreement expires in November 2016.
(d) Represents interest incurred on notes payable and wholesale settlements.
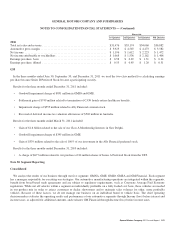
Note 29. Supplementary Quarterly Financial Information (Unaudited)
Consolidated
The following tables summarize supplementary quarterly financial information (dollars in millions, except per share amounts):
Successor
1st Quarter 2nd Quarter 3rd Quarter 4th Quarter
2011
Total net sales and revenue ............................................. $36,194 $39,373 $36,719 $37,990
Automotive gross margin .............................................. $ 4,214 $ 5,250 $ 4,594 $ 4,422
Net income ......................................................... $ 3,411 $ 3,037 $ 2,092 $ 747
Net income attributable to stockholders ................................... $ 3,366 $ 2,992 $ 2,107 $ 725
Earnings per share, basic .............................................. $ 2.09 $ 1.68 $ 1.10 $ 0.30
Earnings per share, diluted ............................................. $ 1.77 $ 1.54 $ 1.03 $ 0.28
180 General Motors Company 2011 Annual Report