General Motors 2011 Annual Report Download - page 153
Download and view the complete annual report
Please find page 153 of the 2011 General Motors annual report below. You can navigate through the pages in the report by either clicking on the pages listed below, or by using the keyword search tool below to find specific information within the annual report.-
 1
1 -
2
-
3
-
4
-
5
-
6
-
7
-
8
-
9
-
10
-
11
-
12
-
13
-
14
-
15
-
16
-
17
-
18
-
19
-
20
-
21
-
22
-
23
-
24
-
25
-
26
-
27
-
28
-
29
-
30
-
31
-
32
-
33
-
34
-
35
-
36
-
37
-
38
-
39
-
40
-
41
-
42
-
43
-
44
-
45
-
46
-
47
-
48
-
49
-
50
-
51
-
52
-
53
-
54
-
55
-
56
-
57
-
58
-
59
-
60
-
61
-
62
-
63
-
64
-
65
-
66
-
67
-
68
-
69
-
70
-
71
-
72
-
73
-
74
-
75
-
76
-
77
-
78
-
79
-
80
-
81
-
82
-
83
-
84
-
85
-
86
-
87
-
88
-
89
-
90
-
91
-
92
-
93
-
94
-
95
-
96
-
97
-
98
-
99
-
100
-
101
-
102
-
103
-
104
-
105
-
106
-
107
-
108
-
109
-
110
-
111
-
112
-
113
-
114
-
115
-
116
-
117
-
118
-
119
-
120
-
121
-
122
-
123
-
124
-
125
-
126
-
127
-
128
-
129
-
130
-
131
-
132
-
133
-
134
-
135
-
136
-
137
-
138
-
139
-
140
-
141
-
142
-
 143
143 -
 144
144 -
 145
145 -
 146
146 -
 147
147 -
 148
148 -
 149
149 -
 150
150 -
 151
151 -
 152
152 -
 153
153 -
 154
154 -
 155
155 -
 156
156 -
 157
157 -
 158
158 -
 159
159 -
 160
160 -
 161
161 -
 162
162 -
 163
163 -
164
-
165
-
166
-
167
-
168
-
169
-
170
-
171
-
172
-
173
-
174
-
175
-
176
-
177
-
178
-
179
-
180
-
181
-
182
-
183
-
184
-
185
-
186
-
187
-
188
-
189
-
190
-
191
-
192
-
193
-
194
-
195
-
196
-
197
-
198
-
199
-
200
 |
 |

GENERAL MOTORS COMPANY AND SUBSIDIARIES
NOTES TO CONSOLIDATED FINANCIAL STATEMENTS — (Continued)
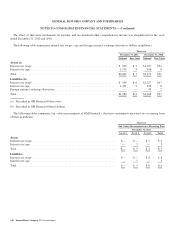
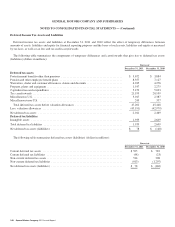
The following table summarizes financial statement classification and amounts of gains (losses) that were reclassified from
Accumulated other comprehensive income (loss) into earnings related to effective cash flow hedging relationships (dollars in
millions):
Predecessor
January 1, 2009
Through
July 9, 2009
Automotive sales ................................................................................. $(351)
Automotivecostofsales ........................................................................... 19
Reorganizationgains,net .......................................................................... 247
Net losses reclassified from Accumulated other comprehensive income (loss) ................................. $ (85)
The following table summarizes financial statement classification and amounts of gains (losses) that were reclassified from
Accumulated other comprehensive income (loss) for cash flow hedges associated with previously forecasted transactions that
subsequently became probable not to occur (dollars in millions):
Predecessor
January 1, 2009
Through
July 9, 2009
Automotive sales ................................................................................. $(182)
Reorganizationgains,net .......................................................................... 247
Net gains reclassified from Accumulated other comprehensive income (loss) . . . . . . . . . . . . . . . . . . . . . . . . . . . . . . . . . $ 65
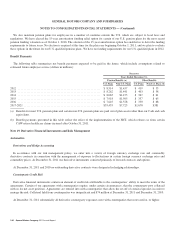
Net Change in Accumulated Other Comprehensive Income (Loss)
The following table summarizes the net change in Accumulated other comprehensive income (loss) related to cash flow hedging
activities (dollars in millions):
Predecessor
January 1, 2009
Through
July 9, 2009
Beginning net unrealized loss on derivatives ........................................................... $(490)
Reclassificationtoearnings ........................................................................ 99
Ending net unrealized loss on derivatives .............................................................. $(391)
In connection with our application of fresh-start reporting, the remaining previously deferred cash flow hedging gains and losses of
$391 million in Accumulated other comprehensive income (loss) were adjusted to $0 at July 10, 2009.
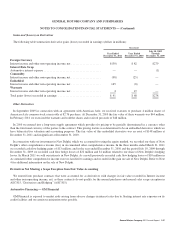
Derivatives Not Meeting a Scope Exception from Fair Value Accounting
Old GM previously entered into purchase contracts that were accounted for as derivatives with changes in fair value recorded in
Automotive cost of sales, as these contracts did not qualify for the normal purchases and normal sales scope exception in ASC 815.
Certain of these contracts were terminated in the period January 1, 2009 through July 9, 2009. MLC retained the remainder of these
purchase contracts in connection with the 363 Sale.
General Motors Company 2011 Annual Report 151