General Motors 2011 Annual Report Download - page 108
Download and view the complete annual report
Please find page 108 of the 2011 General Motors annual report below. You can navigate through the pages in the report by either clicking on the pages listed below, or by using the keyword search tool below to find specific information within the annual report.-
 1
1 -
2
-
3
-
4
-
5
-
6
-
7
-
8
-
9
-
10
-
11
-
12
-
13
-
14
-
15
-
16
-
17
-
18
-
19
-
20
-
21
-
22
-
23
-
24
-
25
-
26
-
27
-
28
-
29
-
30
-
31
-
32
-
33
-
34
-
35
-
36
-
37
-
38
-
39
-
40
-
41
-
42
-
43
-
44
-
45
-
46
-
47
-
48
-
49
-
50
-
51
-
52
-
53
-
54
-
55
-
56
-
57
-
58
-
59
-
60
-
61
-
62
-
63
-
64
-
65
-
66
-
67
-
68
-
69
-
70
-
71
-
72
-
73
-
74
-
75
-
76
-
77
-
78
-
79
-
80
-
81
-
82
-
83
-
84
-
85
-
86
-
87
-
88
-
89
-
90
-
91
-
92
-
93
-
94
-
95
-
96
-
97
-
 98
98 -
 99
99 -
 100
100 -
 101
101 -
 102
102 -
 103
103 -
 104
104 -
 105
105 -
 106
106 -
 107
107 -
 108
108 -
 109
109 -
 110
110 -
 111
111 -
 112
112 -
 113
113 -
 114
114 -
 115
115 -
 116
116 -
 117
117 -
 118
118 -
119
-
120
-
121
-
122
-
123
-
124
-
125
-
126
-
127
-
128
-
129
-
130
-
131
-
132
-
133
-
134
-
135
-
136
-
137
-
138
-
139
-
140
-
141
-
142
-
143
-
144
-
145
-
146
-
147
-
148
-
149
-
150
-
151
-
152
-
153
-
154
-
155
-
156
-
157
-
158
-
159
-
160
-
161
-
162
-
163
-
164
-
165
-
166
-
167
-
168
-
169
-
170
-
171
-
172
-
173
-
174
-
175
-
176
-
177
-
178
-
179
-
180
-
181
-
182
-
183
-
184
-
185
-
186
-
187
-
188
-
189
-
190
-
191
-
192
-
193
-
194
-
195
-
196
-
197
-
198
-
199
-
200
 |
 |
GENERAL MOTORS COMPANY AND SUBSIDIARIES
NOTES TO CONSOLIDATED FINANCIAL STATEMENTS — (Continued)
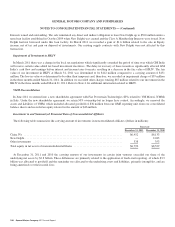
Automotive Financing — GM Financial
GM Financial originates leases in the U.S. and Canada that are recorded as operating leases. A Canadian subsidiary of GM
Financial originates and sells leases to a third party with servicing retained. At December 31, 2011 this subsidiary was servicing
leased vehicles of $1.0 billion for this third-party.
The following table summarizes equipment on operating leases, net (dollars in millions):
Successor
December 31, 2011
Equipmentonoperatingleases—leasedvehicles ..................................................... $ 860
Less: accumulated depreciation ................................................................... (75)
Equipmentonoperatingleases,net ................................................................ $ 785
The following table summarizes depreciation expense related to equipment on operating leases, net (dollars in millions):
Successor
Year Ended
December 31, 2011
Depreciationexpense ........................................................................... $ 70
The following table summarizes minimum rental payments due to GM Financial as lessor under operating leases (dollars in
millions):
2012 2013 2014 2015 2016
Minimum rental receipts under operating leases ......................................... $153 $147 $100 $36 $5
Note 10. Equity in Net Assets of Nonconsolidated Affiliates
Automotive
Nonconsolidated affiliates are entities in which an equity ownership interest is maintained and for which the equity method of
accounting is used, due to the ability to exert significant influence over decisions relating to their operating and financial affairs.
The following tables summarizes information regarding equity in income (loss), net of tax and gain on disposal of investments and
disposition of interest in nonconsolidated affiliates (dollars in millions):
Successor Predecessor
Year Ended
December 31, 2011
Year Ended
December 31, 2010
July 10, 2009
Through
December 31, 2009
January 1, 2009
Through
July 9, 2009
Ally Financial ...................................... $(1,097)
Gain on conversion of UST Ally Financial Loan ........... 2,477
Total equity in income of and disposition of interest in Ally
Financial ........................................ $1,380
China JVs .......................................... $1,511 $1,297 $460 $ 300
New Delphi (including gain on disposition) ............... 1,727 117 (1) —
Others ............................................ (46) 24 38 (239)
Total equity income, net of tax and gain on disposal of
investments ...................................... $3,192 $1,438 $497 $ 61
106 General Motors Company 2011 Annual Report