General Motors 2011 Annual Report Download - page 127
Download and view the complete annual report
Please find page 127 of the 2011 General Motors annual report below. You can navigate through the pages in the report by either clicking on the pages listed below, or by using the keyword search tool below to find specific information within the annual report.-
 1
1 -
2
-
3
-
4
-
5
-
6
-
7
-
8
-
9
-
10
-
11
-
12
-
13
-
14
-
15
-
16
-
17
-
18
-
19
-
20
-
21
-
22
-
23
-
24
-
25
-
26
-
27
-
28
-
29
-
30
-
31
-
32
-
33
-
34
-
35
-
36
-
37
-
38
-
39
-
40
-
41
-
42
-
43
-
44
-
45
-
46
-
47
-
48
-
49
-
50
-
51
-
52
-
53
-
54
-
55
-
56
-
57
-
58
-
59
-
60
-
61
-
62
-
63
-
64
-
65
-
66
-
67
-
68
-
69
-
70
-
71
-
72
-
73
-
74
-
75
-
76
-
77
-
78
-
79
-
80
-
81
-
82
-
83
-
84
-
85
-
86
-
87
-
88
-
89
-
90
-
91
-
92
-
93
-
94
-
95
-
96
-
97
-
98
-
99
-
100
-
101
-
102
-
103
-
104
-
105
-
106
-
107
-
108
-
109
-
110
-
111
-
112
-
113
-
114
-
115
-
116
-
 117
117 -
 118
118 -
 119
119 -
 120
120 -
 121
121 -
 122
122 -
 123
123 -
 124
124 -
 125
125 -
 126
126 -
 127
127 -
 128
128 -
 129
129 -
 130
130 -
 131
131 -
 132
132 -
 133
133 -
 134
134 -
 135
135 -
 136
136 -
 137
137 -
138
-
139
-
140
-
141
-
142
-
143
-
144
-
145
-
146
-
147
-
148
-
149
-
150
-
151
-
152
-
153
-
154
-
155
-
156
-
157
-
158
-
159
-
160
-
161
-
162
-
163
-
164
-
165
-
166
-
167
-
168
-
169
-
170
-
171
-
172
-
173
-
174
-
175
-
176
-
177
-
178
-
179
-
180
-
181
-
182
-
183
-
184
-
185
-
186
-
187
-
188
-
189
-
190
-
191
-
192
-
193
-
194
-
195
-
196
-
197
-
198
-
199
-
200
 |
 |

GENERAL MOTORS COMPANY AND SUBSIDIARIES
NOTES TO CONSOLIDATED FINANCIAL STATEMENTS — (Continued)
portfolio performance ratios including portfolio net loss and delinquency ratios, and pool level cumulative net loss ratios, as well as
limits on deferment levels. Failure to meet any of these covenants could result in an event of default under these agreements. If an
event of default occurs under these agreements, the lenders could elect to declare all amounts outstanding under these agreements to
be immediately due and payable, enforce their interests against collateral pledged under these agreements or restrict GM Financial’s
ability to obtain additional borrowings under this facility. At December 31, 2011 GM Financial was in compliance with all covenants
in its credit facilities. Refer to Note 14 for additional discussion on GM Financial’s restricted cash.
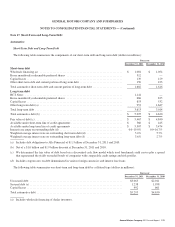
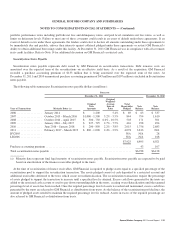
Securitization Notes Payable
Securitization notes payable represents debt issued by GM Financial in securitization transactions. Debt issuance costs are
amortized over the expected term of the securitizations on an effective yield basis. As a result of the acquisition, GM Financial
recorded a purchase accounting premium of $133 million that is being amortized over the expected term of the notes. At
December 31, 2011 and 2010 unamortized purchase accounting premium of $43 million and $107 million is included in Securitization
notes payable.
The following table summarizes Securitization notes payable (dollars in millions):
Successor
December 31, 2011 December 31, 2010
Year of Transactions Maturity Dates (a)
Original
Note
Amounts
Original
Weighted-
Average
Interest
Rates
Total
Receivables
Pledged
Note
Balance
Note
Balance
2006 . . . . . . . . . . . . . . . . . . January 2014 $ 1,200 5.4% $ 69 $ 63 $ 537
2007 . . . . . . . . . . . . . . . . . . October 2013 – March 2016 $1,000 - 1,500 5.2% - 5.5% 844 794 1,610
2008 . . . . . . . . . . . . . . . . . . October 2014 – April 2015 $ 500 - 750 6.0% - 10.5% 503 171 501
2009 . . . . . . . . . . . . . . . . . . January 2016 – July 2017 $ 227 - 725 2.7% - 7.5% 416 298 494
2010 . . . . . . . . . . . . . . . . . . June 2016 – January 2018 $ 200 - 850 2.2% - 3.8% 2,015 1,756 2,683
2011 . . . . . . . . . . . . . . . . . . February 2017 – March 2019 $ 800 - 1,000 2.4% - 2.9% 4,078 3,813 N/A
BV2005 . . . . . . . . . . . . . . . N/A N/A 28
LB2006 . . . . . . . . . . . . . . . N/A N/A 168
$7,925 6,895 6,021
Purchaseaccountingpremium............................................................ 43 107
Total securitization notes payable ......................................................... $6,938 $6,128
(a) Maturity dates represent final legal maturity of securitization notes payable. Securitization notes payable are expected to be paid
based on amortization of the finance receivables pledged to the trusts.
At the time of securitization of finance receivables, GM Financial is required to pledge assets equal to a specified percentage of the
securitization pool to support the securitization transaction. The assets pledged consist of cash deposited to a restricted account and
additional receivables delivered to the trust, which create overcollateralization. The securitization transactions require the percentage
of assets pledged to support the transaction to increase until a specified level is attained. Excess cash flows generated by the trusts are
added to the restricted cash account or used to pay down outstanding debt in the trusts, creating overcollateralization until the targeted
percentage level of assets has been reached. Once the targeted percentage level of assets is reached and maintained, excess cash flows
generated by the trusts are released to GM Financial as distributions from trusts. As the balance of the securitization pool declines, the
amount of pledged assets needed to maintain the required percentage level is reduced. Assets in excess of the required percentage are
also released to GM Financial as distributions from trusts.
General Motors Company 2011 Annual Report 125