General Motors 2011 Annual Report Download - page 162
Download and view the complete annual report
Please find page 162 of the 2011 General Motors annual report below. You can navigate through the pages in the report by either clicking on the pages listed below, or by using the keyword search tool below to find specific information within the annual report.-
 1
1 -
2
-
3
-
4
-
5
-
6
-
7
-
8
-
9
-
10
-
11
-
12
-
13
-
14
-
15
-
16
-
17
-
18
-
19
-
20
-
21
-
22
-
23
-
24
-
25
-
26
-
27
-
28
-
29
-
30
-
31
-
32
-
33
-
34
-
35
-
36
-
37
-
38
-
39
-
40
-
41
-
42
-
43
-
44
-
45
-
46
-
47
-
48
-
49
-
50
-
51
-
52
-
53
-
54
-
55
-
56
-
57
-
58
-
59
-
60
-
61
-
62
-
63
-
64
-
65
-
66
-
67
-
68
-
69
-
70
-
71
-
72
-
73
-
74
-
75
-
76
-
77
-
78
-
79
-
80
-
81
-
82
-
83
-
84
-
85
-
86
-
87
-
88
-
89
-
90
-
91
-
92
-
93
-
94
-
95
-
96
-
97
-
98
-
99
-
100
-
101
-
102
-
103
-
104
-
105
-
106
-
107
-
108
-
109
-
110
-
111
-
112
-
113
-
114
-
115
-
116
-
117
-
118
-
119
-
120
-
121
-
122
-
123
-
124
-
125
-
126
-
127
-
128
-
129
-
130
-
131
-
132
-
133
-
134
-
135
-
136
-
137
-
138
-
139
-
140
-
141
-
142
-
143
-
144
-
145
-
146
-
147
-
148
-
149
-
150
-
151
-
 152
152 -
 153
153 -
 154
154 -
 155
155 -
 156
156 -
 157
157 -
 158
158 -
 159
159 -
 160
160 -
 161
161 -
 162
162 -
 163
163 -
 164
164 -
 165
165 -
 166
166 -
 167
167 -
 168
168 -
 169
169 -
 170
170 -
 171
171 -
 172
172 -
173
-
174
-
175
-
176
-
177
-
178
-
179
-
180
-
181
-
182
-
183
-
184
-
185
-
186
-
187
-
188
-
189
-
190
-
191
-
192
-
193
-
194
-
195
-
196
-
197
-
198
-
199
-
200
 |
 |

GENERAL MOTORS COMPANY AND SUBSIDIARIES
NOTES TO CONSOLIDATED FINANCIAL STATEMENTS — (Continued)
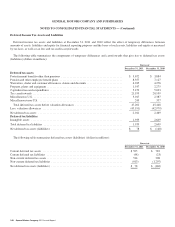
Deferred Income Tax Assets and Liabilities
Deferred income tax assets and liabilities at December 31, 2011 and 2010 reflect the effect of temporary differences between
amounts of assets, liabilities and equity for financial reporting purposes and the bases of such assets, liabilities and equity as measured
by tax laws, as well as tax loss and tax credit carryforwards.
The following table summarizes the components of temporary differences and carryforwards that give rise to deferred tax assets
(liabilities) (dollars in millions):
Successor
December 31, 2011 December 31, 2010
Deferred tax assets
Postretirement benefits other than pensions ........................................... $ 3,672 $ 3,884
Pension and other employee benefit plans ............................................ 8,357 7,127
Warranties, dealer and customer allowances, claims and discounts ......................... 4,015 4,276
Property, plants and equipment ..................................................... 1,547 2,275
Capitalized research expenditures ................................................... 5,152 5,033
Tax carryforwards ............................................................... 21,199 20,109
Miscellaneous U.S. .............................................................. 3,017 2,387
Miscellaneousnon-U.S. .......................................................... 243 357
Total deferred tax assets before valuation allowances ................................. 47,202 45,448
Less: valuation allowances ........................................................ (45,191) (42,979)
Net deferred tax assets ........................................................... 2,011 2,469
Deferred tax liabilities
Intangible assets ................................................................ 1,933 2,609
Total deferred tax liabilities ....................................................... 1,933 2,609
Netdeferredtaxassets(liabilities) .................................................. $ 78 $ (140)
The following table summarizes deferred tax assets (liabilities) (dollars in millions):
Successor
December 31, 2011 December 31, 2010
Currentdeferredtaxassets ........................................................ $525 $ 782
Current deferred tax liabilities ..................................................... (48) (23)
Non-currentdeferredtaxassets..................................................... 514 308
Non-current deferred tax liabilities .................................................. (913) (1,207)
Netdeferredtaxassets(liabilities) .................................................. $ 78 $ (140)
160 General Motors Company 2011 Annual Report