General Motors 2011 Annual Report Download - page 40
Download and view the complete annual report
Please find page 40 of the 2011 General Motors annual report below. You can navigate through the pages in the report by either clicking on the pages listed below, or by using the keyword search tool below to find specific information within the annual report.-
 1
1 -
2
-
3
-
4
-
5
-
6
-
7
-
8
-
9
-
10
-
11
-
12
-
13
-
14
-
15
-
16
-
17
-
18
-
19
-
20
-
21
-
22
-
23
-
24
-
25
-
26
-
27
-
28
-
29
-
 30
30 -
 31
31 -
 32
32 -
 33
33 -
 34
34 -
 35
35 -
 36
36 -
 37
37 -
 38
38 -
 39
39 -
 40
40 -
 41
41 -
 42
42 -
 43
43 -
 44
44 -
 45
45 -
 46
46 -
 47
47 -
 48
48 -
 49
49 -
 50
50 -
51
-
52
-
53
-
54
-
55
-
56
-
57
-
58
-
59
-
60
-
61
-
62
-
63
-
64
-
65
-
66
-
67
-
68
-
69
-
70
-
71
-
72
-
73
-
74
-
75
-
76
-
77
-
78
-
79
-
80
-
81
-
82
-
83
-
84
-
85
-
86
-
87
-
88
-
89
-
90
-
91
-
92
-
93
-
94
-
95
-
96
-
97
-
98
-
99
-
100
-
101
-
102
-
103
-
104
-
105
-
106
-
107
-
108
-
109
-
110
-
111
-
112
-
113
-
114
-
115
-
116
-
117
-
118
-
119
-
120
-
121
-
122
-
123
-
124
-
125
-
126
-
127
-
128
-
129
-
130
-
131
-
132
-
133
-
134
-
135
-
136
-
137
-
138
-
139
-
140
-
141
-
142
-
143
-
144
-
145
-
146
-
147
-
148
-
149
-
150
-
151
-
152
-
153
-
154
-
155
-
156
-
157
-
158
-
159
-
160
-
161
-
162
-
163
-
164
-
165
-
166
-
167
-
168
-
169
-
170
-
171
-
172
-
173
-
174
-
175
-
176
-
177
-
178
-
179
-
180
-
181
-
182
-
183
-
184
-
185
-
186
-
187
-
188
-
189
-
190
-
191
-
192
-
193
-
194
-
195
-
196
-
197
-
198
-
199
-
200
 |
 |

GENERAL MOTORS COMPANY AND SUBSIDIARIES
growth throughout the region (2) favorable net foreign currency translation effect of $0.5 billion, due to the strengthening of major
currencies such as the Brazilian Real and Colombian Peso against the U.S. Dollar; (3) favorable vehicle pricing effect of $0.3 billion,
due to the hyperinflationary economy in Venezuela; and (4) favorable vehicle mix of $0.1 billion due mainly to increased sales of the
Chevrolet Cruze.
In the year ended December 31, 2010 Total net sales and revenue increased by $2.2 billion (or 17.1%) due primarily to:
(1) increased wholesale volumes of $2.2 billion representing 170,000 vehicles (or 19.1%) due to launches of the Chevrolet Cruze and
Chevrolet Spark throughout the region; (2) favorable net foreign currency translation effect of $1.0 billion, due to the strengthening of
major currencies such as the Brazilian Real and Colombian Peso against the U.S. Dollar; (3) favorable vehicle pricing effect of $0.3
billion, due to the hyperinflationary economy in Venezuela; partially offset by (4) devaluation of the BsF of $0.9 billion; and
(5) unfavorable vehicle mix of $0.4 billion due to increased sales of the Chevrolet Spark and Chevrolet Aveo and decreased sales of
the Chevrolet Meriva, Vectra and S-10.
GMSA EBIT (Loss)-Adjusted
GM
In the year ended December 31, 2011 EBIT-adjusted was a loss of $0.1 billion as compared to EBIT-adjusted of $0.8 billion in the
year ended December 31, 2010 due primarily to: (1) increased material and freight of $0.7 billion; (2) increased manufacturing costs
of $0.3 billion; and (3) foreign currency transaction gains of $0.3 billion recorded in 2010 due to preferential foreign currency
exchange rates in Venezuela, which were discontinued in 2011; and (4) unfavorable $0.1 billion related to separation costs; partially
offset by (5) favorable vehicle pricing effect of $0.3 billion due to the hyperinflationary economy in Venezuela.
In the year ended December 31, 2010 EBIT-adjusted was $0.8 billion and included: (1) foreign currency transaction gains of
$0.3 billion due to foreign currency exchanges processed at the preferential rate in Venezuela; offset by (2) administrative expenses of
$0.5 billion; (3) advertising and sales promotion expenses of $0.3 billion to support media campaigns for our products; and (4) selling
and marketing expenses of $0.1 billion.
In January 2010 the Venezuelan government announced that the official fixed exchange rate of 2.15 BsF to $1.00 would be changed
to a dual rate system that includes a 2.60 BsF to $1.00 essentials rate for food, technology and heavy machine importers and a 4.30
BsF to $1.00 non-essentials rate for all others. This devaluation required remeasurement of our Venezuelan subsidiaries’
non-U.S. Dollar denominated monetary assets and liabilities. We used a rate of 4.30 BsF to $1.00 to determine the remeasurement,
which resulted in a charge of $25 million recorded in Automotive cost of sales in the year ended December 31, 2010.
In the period July 10, 2009 through December 31, 2009 EBIT-adjusted was $0.4 billion and included: (1) administrative expenses
of $0.2 billion; (2) advertising and sales promotion expenses of $0.1 billion; and (3) selling and marketing expenses of $0.1 billion.
Old GM
In the period January 1, 2009 through July 9, 2009 EBIT-adjusted was a loss of $0.5 billion and included: (1) foreign currency
transaction losses of $0.5 billion due to foreign currency exchanges processed outside the Venezuela currency exchange agency;
(2) administrative expenses of $0.2 billion; (3) advertising and sales promotion expenses of $0.1 billion; and (4) selling and marketing
expenses of $0.1 billion.
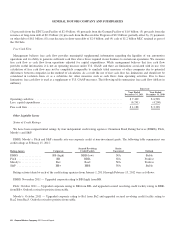
GM Financial
(Dollars in Millions)
Successor
Year Ended
December 31, 2011
Three Months
Ended
December 31, 2010
Total revenue ................................................................... $1,410 $281
Incomebeforeincometaxes ....................................................... $ 622 $129
38 General Motors Company 2011 Annual Report